3D Doughnut Chart-14
05
May 2018
3200
PK
Meet PK, the founder of PK-AnExcelExpert.com! With over 15 years of experience in Data Visualization, Excel Automation, and dashboard creation. PK is a Microsoft Certified Professional who has a passion for all things in Excel. PK loves to explore new and innovative ways to use Excel and is always eager to share his knowledge with others. With an eye for detail and a commitment to excellence, PK has become a go-to expert in the world of Excel. Whether you're looking to create stunning visualizations or streamline your workflow with automation, PK has the skills and expertise to help you succeed. Join the many satisfied clients who have benefited from PK's services and see how he can take your Excel skills to the next level!
https://www.pk-anexcelexpert.com
Related Articles
Half Circle KPI Charts in Excel using Doughnut Charts
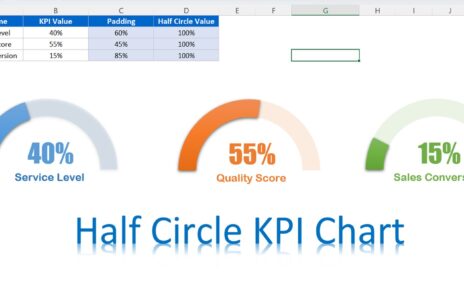
Key Performance Indicators (KPIs) are metrics used to measure the success of a company or a particular project. KPIs can
Power BI dashboard with 3D Glass Chart
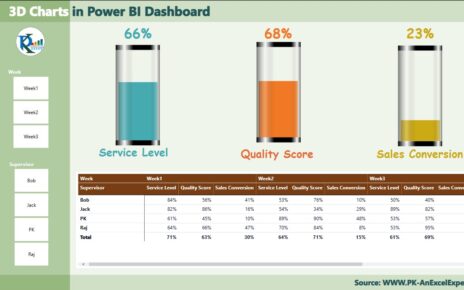
Data visualization is an important part of modern businesses. It helps companies to make decisions based on data-driven insights. Microsoft
Highlight Top and Bottom Performer using conditional formatting
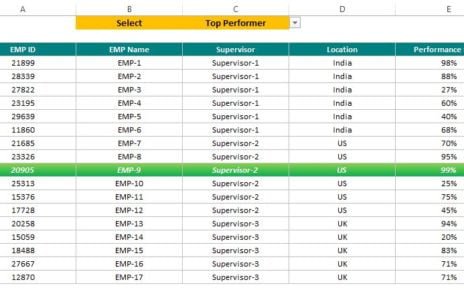
In this article you will learn how to use Conditional Formatting to Highlight Top and Bottom performer on the base