Home>Blogs>Charts and Visualization>Info-graphics: Stunning Thermometer Chart in Excel>Stunning Thermometer Chart-2
Stunning Thermometer Chart-2
03
Apr 2019
789Comments Off on Stunning Thermometer Chart-2
PK
Meet PK, the founder of PK-AnExcelExpert.com! With over 15 years of experience in Data Visualization, Excel Automation, and dashboard creation. PK is a Microsoft Certified Professional who has a passion for all things in Excel. PK loves to explore new and innovative ways to use Excel and is always eager to share his knowledge with others. With an eye for detail and a commitment to excellence, PK has become a go-to expert in the world of Excel. Whether you're looking to create stunning visualizations or streamline your workflow with automation, PK has the skills and expertise to help you succeed. Join the many satisfied clients who have benefited from PK's services and see how he can take your Excel skills to the next level!
https://www.pk-anexcelexpert.com
Related Articles
RANDBETWEEN function in Excel with Examples
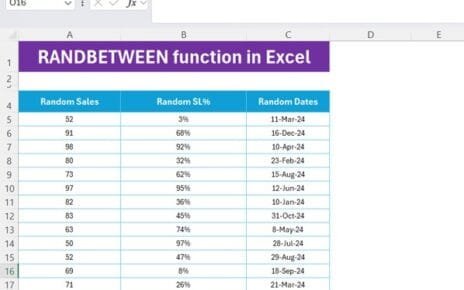
Welcome to another exciting guide where we'll explore the RANDBETWEEN function in Excel If you're looking to generate random numbers,
Project Management Documentation Checklist in Excel
Managing a project without proper documentation can quickly turn into a nightmare. It’s easy to lose track of tasks, responsibilities,
Non-Profit KPI Dashboard in Excel
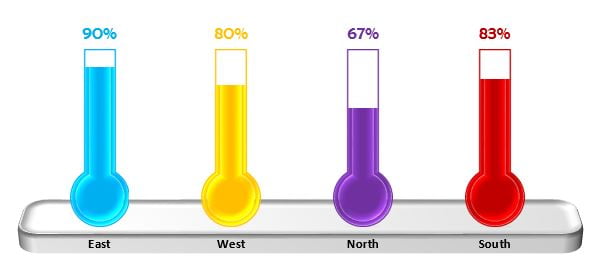
In today's data-driven world, Non-Profit KPI Dashboard in Excel organizations need effective tools to track their performance and impact. One