Liquid fill Gauge Chart-1
10
Jun 2019
1988Comments Off on Liquid fill Gauge Chart-1
PK
Meet PK, the founder of PK-AnExcelExpert.com! With over 15 years of experience in Data Visualization, Excel Automation, and dashboard creation. PK is a Microsoft Certified Professional who has a passion for all things in Excel. PK loves to explore new and innovative ways to use Excel and is always eager to share his knowledge with others. With an eye for detail and a commitment to excellence, PK has become a go-to expert in the world of Excel. Whether you're looking to create stunning visualizations or streamline your workflow with automation, PK has the skills and expertise to help you succeed. Join the many satisfied clients who have benefited from PK's services and see how he can take your Excel skills to the next level!
https://www.pk-anexcelexpert.com
Related Articles
Fashion Retail KPI Dashboard in Excel
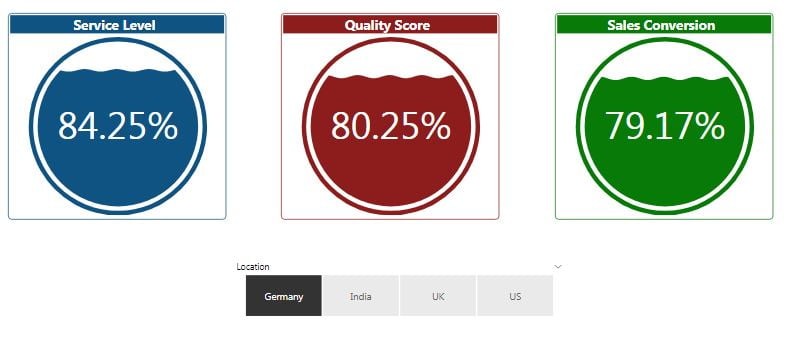
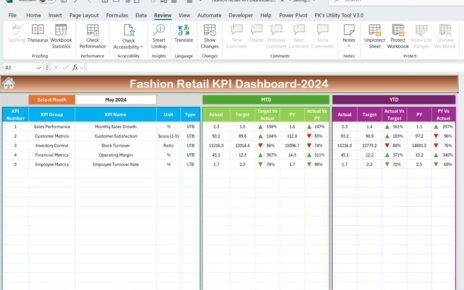
In today's competitive retail environment, harnessing the power of data is crucial for success. A well-constructed Key Performance Indicator (KPI)
Chemical KPI Dashboard in Power BI
In today's world, data is a crucial asset for making informed business decisions. Especially in the chemical industry, where tracking
Table in Power BI
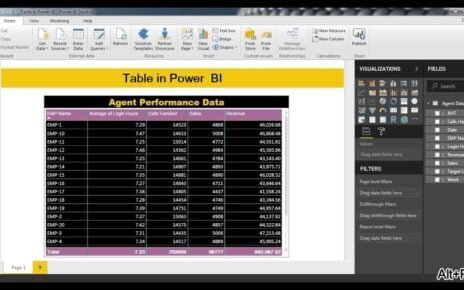
Table Visual is used to show the tabular data in Power BI. In this visual you can see the headers