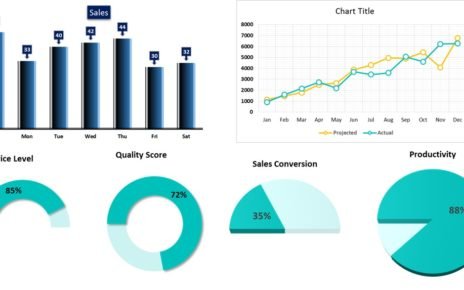
In this article, we have created a Dynamic Chart with Form Control Scrollbar. If we have multiple dates in your data, then we can use scrollbar on the chart to display rolling 10 days or 15 days data points at a time.
Data Set:
We have used below given data set to create this dynamic chart. We have taken here 3 metrics: Sales, Forecast and Revenue. You can change it with your data as per your requirements.

Dynamic Chart with Form Control Scrollbar
Below is the snapshot of this dynamic chart. You can click on the scrollbar to change it then chart will be changed automatically.

Click to buy Dynamic Chart with Form Control Scrollbar
Visit our YouTube channel to learn step-by-step video tutorials
Watch the step by step video tutorial:
Click to buy Dynamic Chart with Form Control Scrollbar


