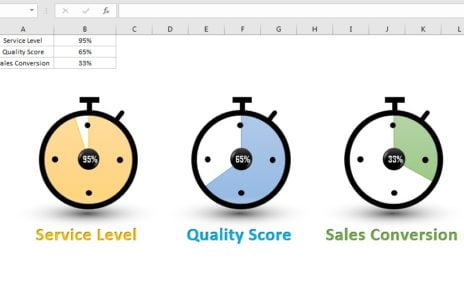
In this article, we have created a beautiful 3D chart to display the Sales conversion for different products. We have used RAG (Red, Amber and Green) Conditional Formatting in this chart. This is a dynamic conditional formatting and it is connected with the color condition table. You can change the color range from the color condition table. You can use this chart in your business dashboard or presentation.
RAG Conditional Formatting in 3D Chart

Click to buy RAG Conditional Formatting in 3D Chart
Visit our YouTube channel to learn step-by-step video tutorials
Watch the step by step video tutorial:
Click to buy RAG Conditional Formatting in 3D Chart


