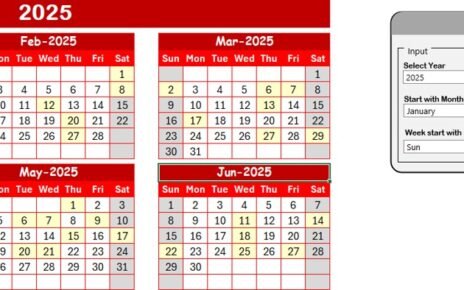
In today’s fast-paced world, staying organized and keeping track of important events, appointments, and deadlines is crucial for both personal
Managing inventory effectively is crucial for businesses to prevent stockouts and maintain customer satisfaction. The Out-of-Stock Rate KPI Dashboard in
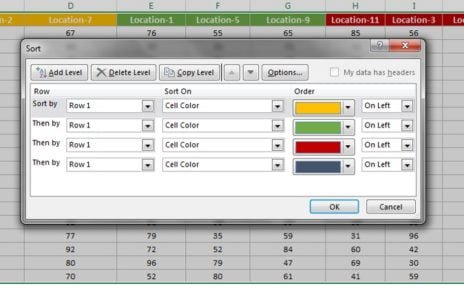
In this article, you will learn how to sort the data by columns. If you have multiple columns in your