Home>Blogs>Charts and Visualization>Dynamic Comparison Analysis Chart in Excel>Dynamic Comparison Analysis Chart
Dynamic Comparison Analysis Chart
01
May 2021
87Comments Off on Dynamic Comparison Analysis Chart
PK
Meet PK, the founder of PK-AnExcelExpert.com! With over 15 years of experience in Data Visualization, Excel Automation, and dashboard creation. PK is a Microsoft Certified Professional who has a passion for all things in Excel. PK loves to explore new and innovative ways to use Excel and is always eager to share his knowledge with others. With an eye for detail and a commitment to excellence, PK has become a go-to expert in the world of Excel. Whether you're looking to create stunning visualizations or streamline your workflow with automation, PK has the skills and expertise to help you succeed. Join the many satisfied clients who have benefited from PK's services and see how he can take your Excel skills to the next level!
https://www.pk-anexcelexpert.com
Related Articles
Public Relations KPI Dashboard In Excel
Using this tool, businesses and PR teams can measure the impact of their PR campaigns, adjust strategies, and improve communication
Expense Management KPI Dashboard in Excel
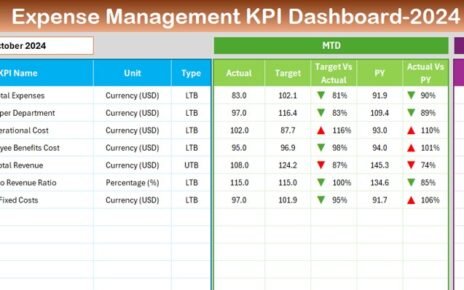
Managing expenses efficiently is crucial for the financial health of any organization, especially in industries like construction, retail, healthcare, and
Public Sector KPI Dashboard in Power BI
The Public Sector KPI Dashboard in Power BI is an advanced and user-friendly tool that streamlines the tracking and analysis