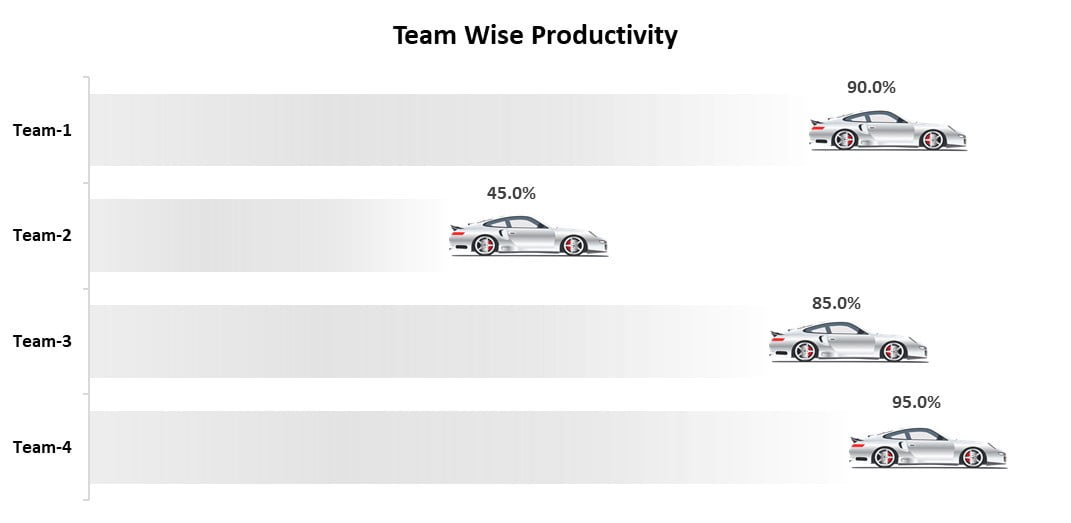
If you’re looking to elevate your data visualization, our innovative “Animated Car Chart in Excel” is exactly what you need. This dynamic and visually appealing chart is perfect because it illustrates comparisons between teams, employees, sales agents, and more. Leveraging the powerful combination of Excel charts and VBA, this product will bring your data to life with engaging animations.
Key Features:
- Dynamic Animation: As cars race to their respective positions on the chart, data comparisons become more engaging and easier to understand.
- Customizable Design: Moreover, you can tailor the look and feel of the chart to match your brand or presentation style, ensuring a cohesive visual experience.
- Interactive Controls: Furthermore, with VBA, you can add interactive elements, allowing users to control the animation and explore data at their own pace.
- Versatile Application: Whether you are comparing performance metrics such as sales figures, team achievements, or employee productivity, this chart is ideal.
- Easy Integration: Additionally, you can seamlessly integrate the animated chart into your existing Excel spreadsheets without needing additional software.
- User-Friendly Interface: Designed for ease of use, it provides step-by-step instructions to help you set up and customize the chart quickly.
- Enhance Presentations: Not only will your presentations stand out, but adding a dynamic and memorable visual element will also capture your audience’s attention.
- Data-Driven Insights: Moreover, it provides clear and impactful data insights, making complex information more accessible and comprehensible.
- Time-Saving Automation: By automating repetitive tasks and data updates, you can focus more on analysis and decision-making.
- Professional Quality: Finally, this product is developed with professional standards to ensure reliability, accuracy, and a polished final product.