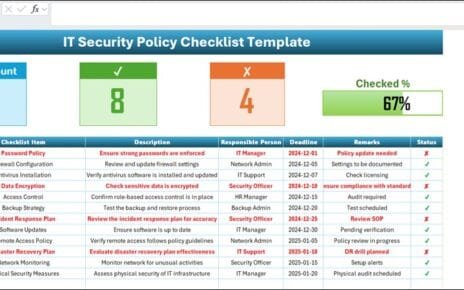
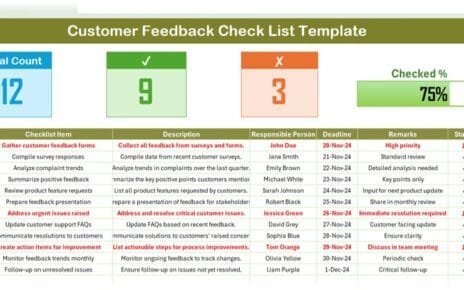
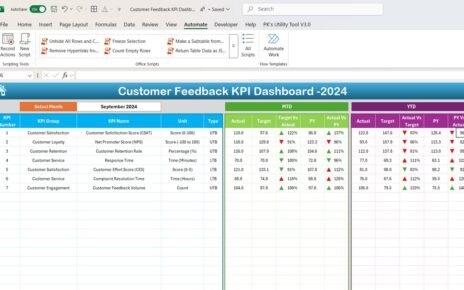
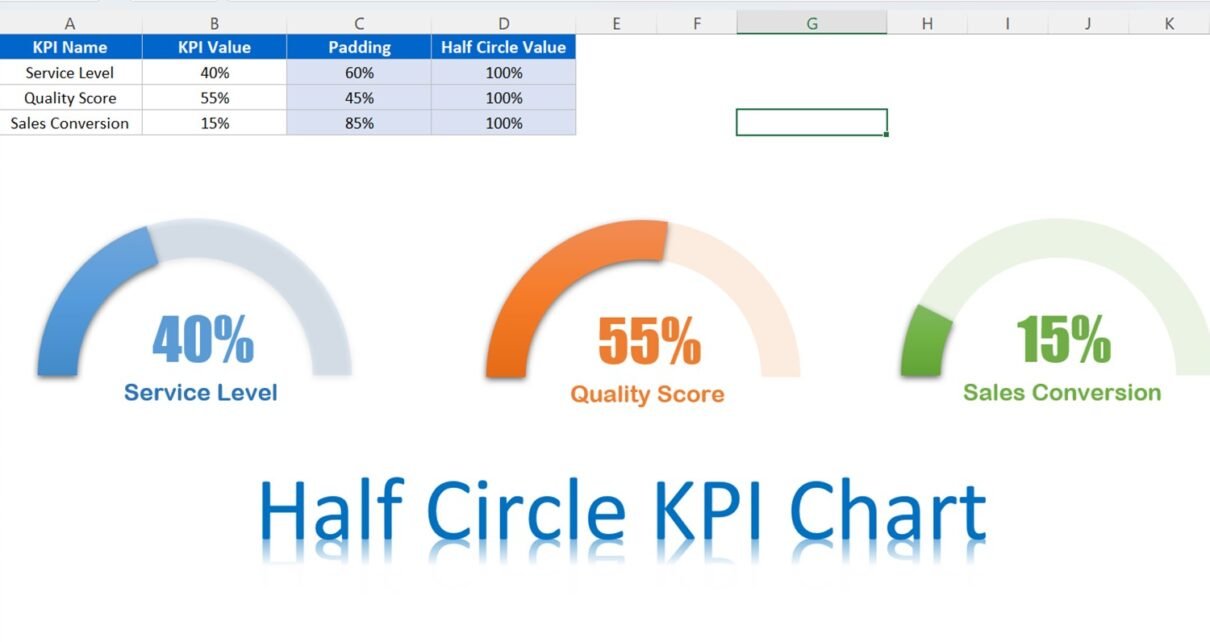
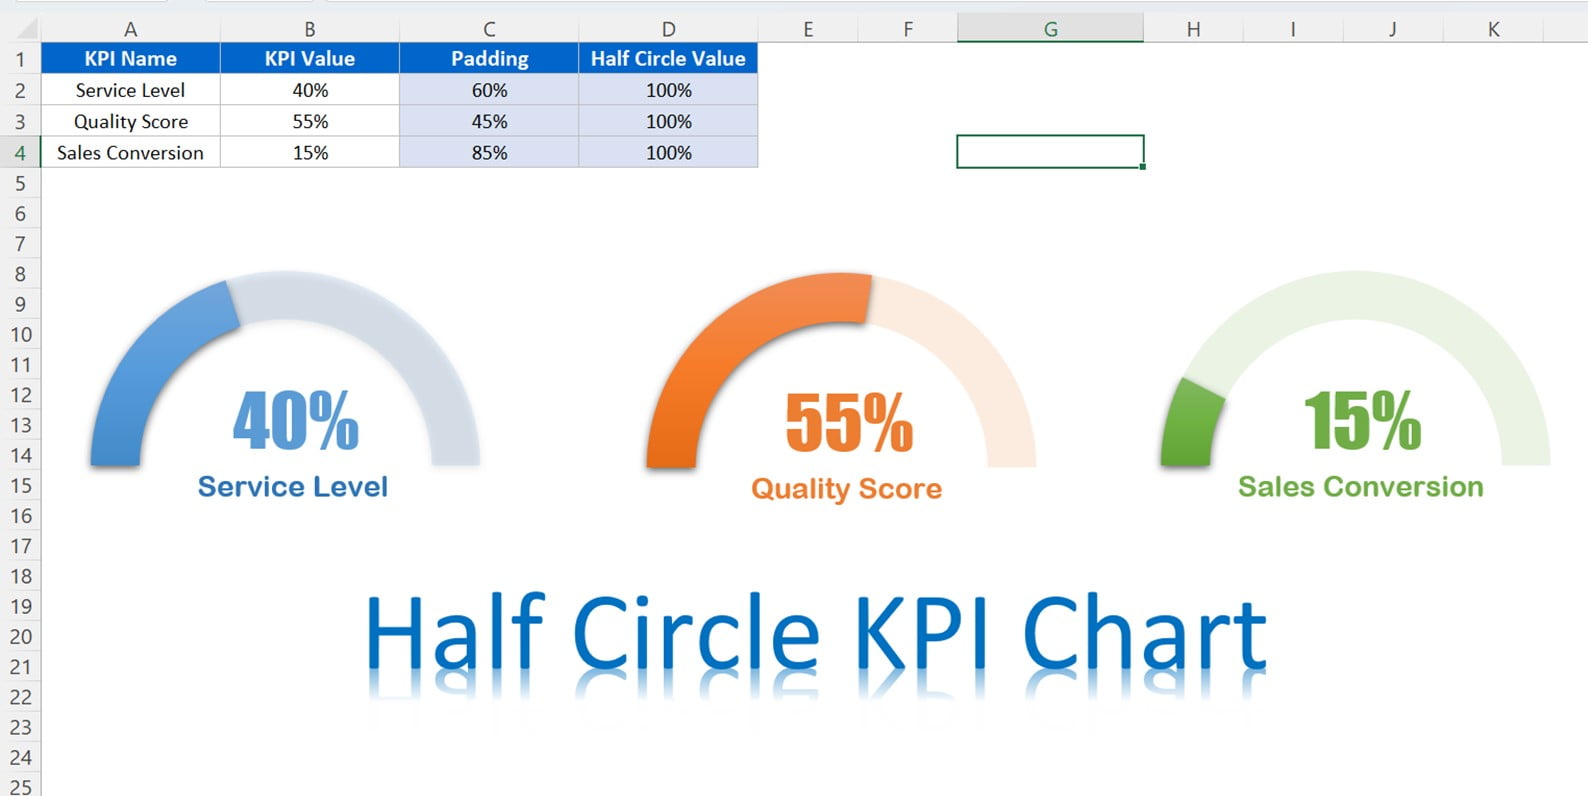
This ready-to-use template offers a streamlined solution for tracking your key performance indicators (KPIs) with ease. Whether you’re monitoring sales targets, project milestones, or financial metrics, this template provides a visually engaging and customizable platform to suit your specific needs
Half Circle KPI Charts in Excel using Doughnut Charts
22
May 2024
267Comments Off on Half Circle KPI Charts in Excel using Doughnut Charts
PK
Meet PK, the founder of PK-AnExcelExpert.com! With over 15 years of experience in Data Visualization, Excel Automation, and dashboard creation. PK is a Microsoft Certified Professional who has a passion for all things in Excel. PK loves to explore new and innovative ways to use Excel and is always eager to share his knowledge with others. With an eye for detail and a commitment to excellence, PK has become a go-to expert in the world of Excel. Whether you're looking to create stunning visualizations or streamline your workflow with automation, PK has the skills and expertise to help you succeed. Join the many satisfied clients who have benefited from PK's services and see how he can take your Excel skills to the next level!
https://www.pk-anexcelexpert.com
Related Articles
Bulk Auto Emailer with Picture Signature and HTML body
In the article, we have created a Bulk Auto Emailer with Picture Signature and HTML body. We have given the
Informative KPI Indicator Chart Version-2
This is the 2nd version of Informative KPI Indicator Chart. In this chart I have used a RAG color pallet
Quick Analysis Tool in Microsoft Excel
Quick Analysis Tool is used to apply the quick conditional formatting, Quick Charts, add Totals, Quick Pivot Tables and to