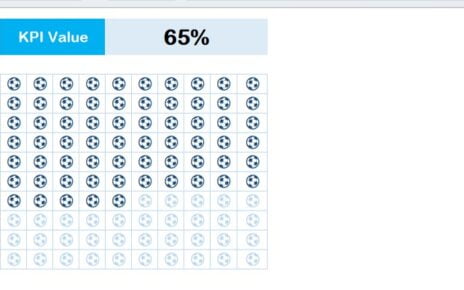
The Process Circle Chart in Excel 2010 is a unique and innovative KPI visualization template, designed specifically for users who want to create visually engaging progress charts without relying on complex doughnut charts. Due to limitations in Excel 2010, the usual Secondary Axis feature in doughnut charts isn’t available, but this template leverages a smart workaround using a pie chart, ensuring seamless functionality across Excel versions from 2010 onward.
Process Circle Chart in Excel

Key Features:
- Compatible with Excel 2010 and beyond – Perfect for users on older versions, ensuring flexibility across all recent Excel releases.
- Creative Pie Chart-based Design – Uses an alternate approach with pie charts to simulate the process circle effect, circumventing the limitations of Excel 2010.
- Multiple Design Variants – Includes three unique process circle chart styles, allowing you to choose the most effective layout for your KPIs.
- Ready-to-Use and Customizable – Download, customize, and start tracking progress immediately with minimal setup.
Read the detailed blog post


