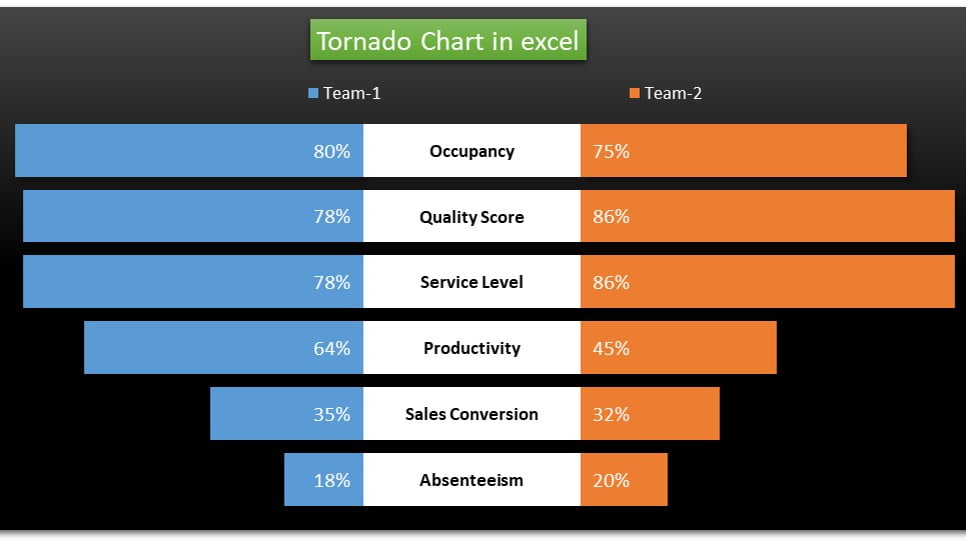
Unlock the potential of your team analysis with our “Master the Art of Team Comparison with Tornado or Butterfly Charts in Excel” digital product. This ready-to-use tool simplifies the creation of visually striking Tornado and Butterfly charts, enabling you to compare teams or groups effortlessly. Perfect for project managers, analysts, and educators, these charts provide a clear and engaging way to highlight differences and similarities within your data.
Master the Art of Team Comparison with Tornado or Butterfly Charts in Excel
30
May 2024
97Comments Off on Master the Art of Team Comparison with Tornado or Butterfly Charts in Excel
PK
Meet PK, the founder of PK-AnExcelExpert.com! With over 15 years of experience in Data Visualization, Excel Automation, and dashboard creation. PK is a Microsoft Certified Professional who has a passion for all things in Excel. PK loves to explore new and innovative ways to use Excel and is always eager to share his knowledge with others. With an eye for detail and a commitment to excellence, PK has become a go-to expert in the world of Excel. Whether you're looking to create stunning visualizations or streamline your workflow with automation, PK has the skills and expertise to help you succeed. Join the many satisfied clients who have benefited from PK's services and see how he can take your Excel skills to the next level!
https://www.pk-anexcelexpert.com
Related Articles
Project Plan (Gantt Chart) in Excel
Crafting a Project Plan (Gantt Chart) in Excel can initially appear to be an intimidating task. This is particularly true
Conditional Formatting in a Lollipop Chart in Excel
Using the Conditional Formatting in a Lollipop Chart in Excel is very useful. It helps to audience to identify which
Data Entry Application in Excel VBA
In this article, we have created a Data Entry Application with List box in Excel VBA. Data is saved in