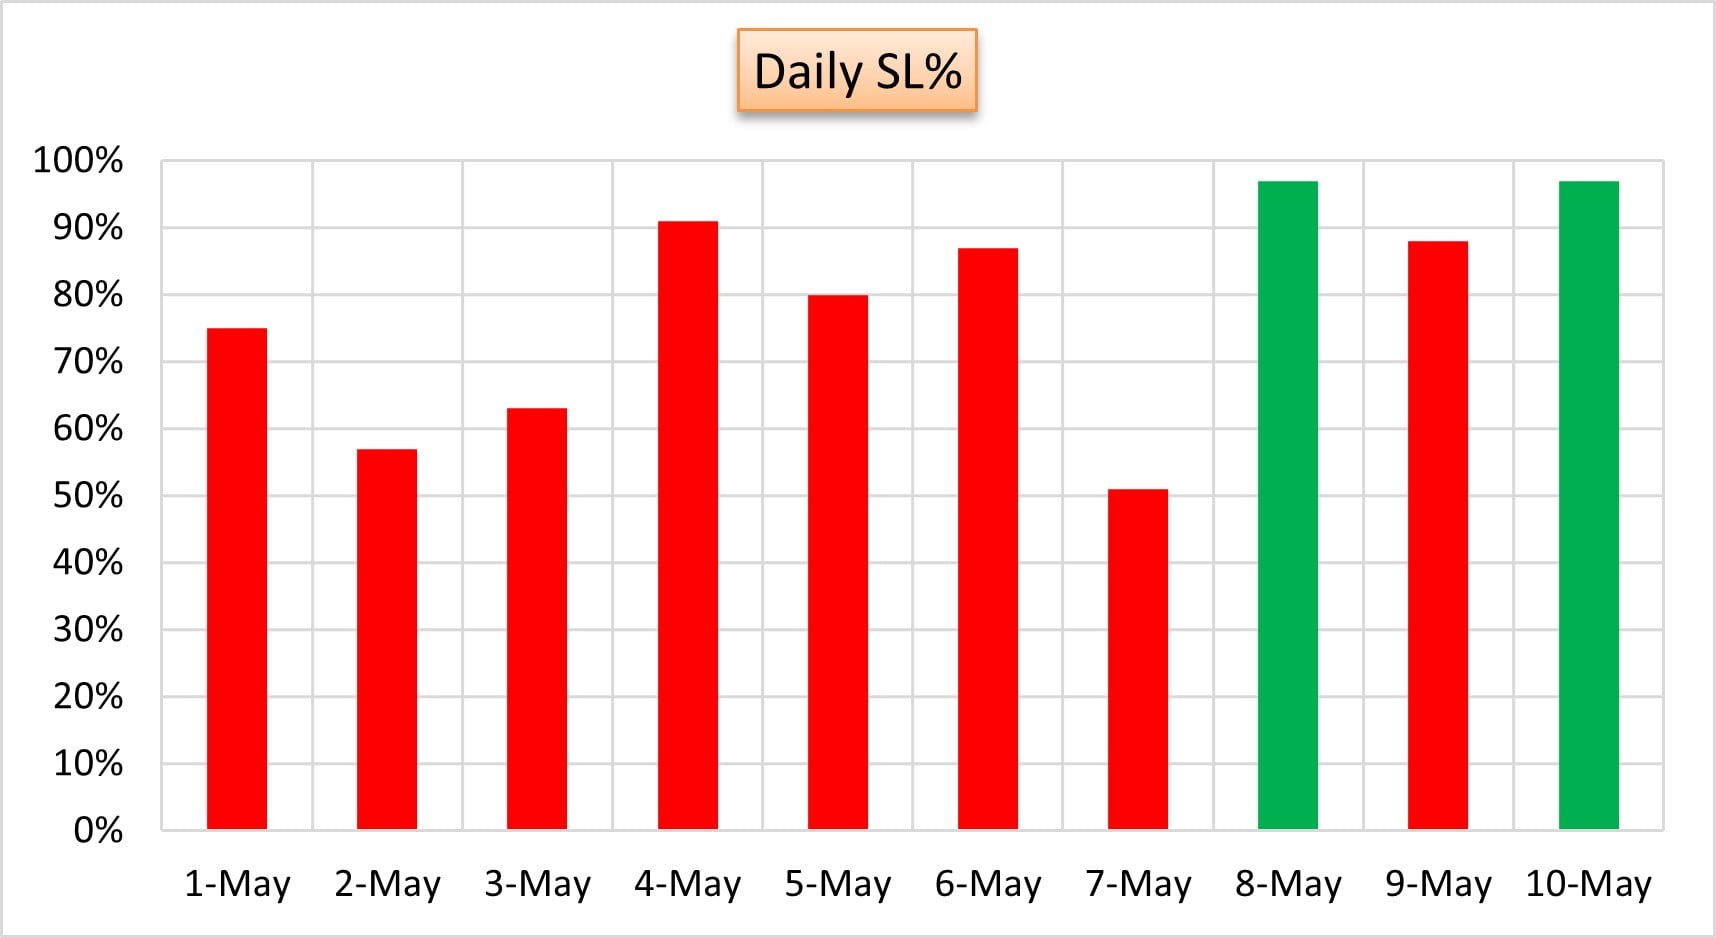
Conditional formatting in Excel Charts allows you to highlight critical differences between Target and Actual values, making it easier to spot trends and deviations. With this template, you can create dynamic charts that automatically adjust based on your data, giving you a clear visual representation of performance.
Key Features:
- Ready-to-use Excel template with customizable conditional formatting.
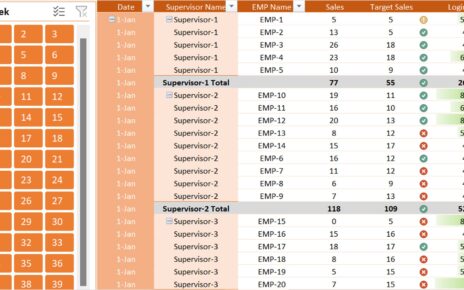
- Easily connects with your data to highlight missing targets or key milestones.
- Step-by-step video tutorial available for effortless chart creation and customization.