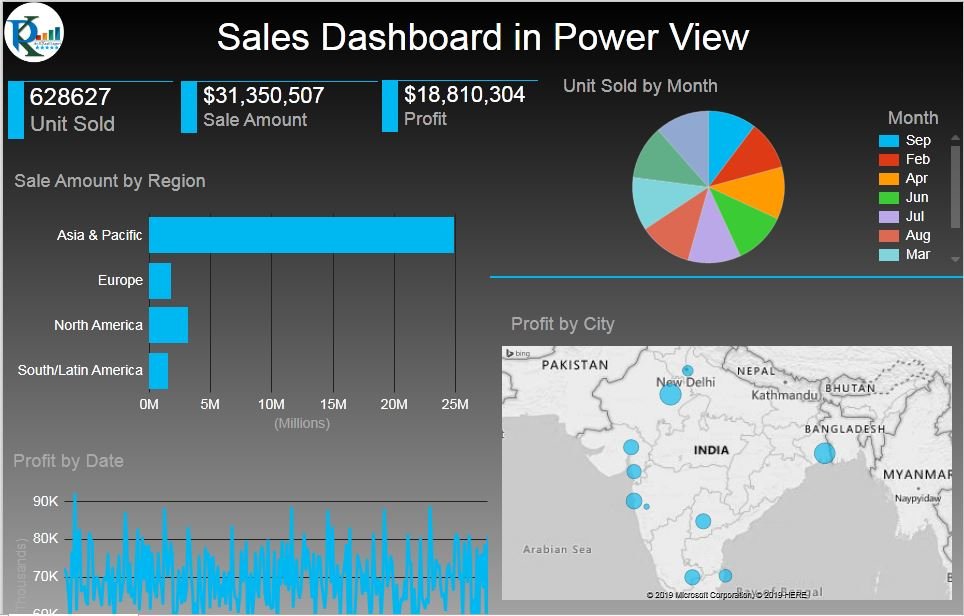
The Sales Dashboard Power View in Excel 2013 offers a visually stunning and interactive way to analyze sales data. Utilizing Power View, this dashboard brings your data to life with dynamic charts, graphs, and maps, allowing for in-depth insights and powerful visualizations.
Key Features:
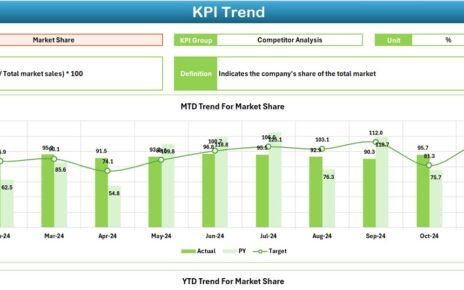
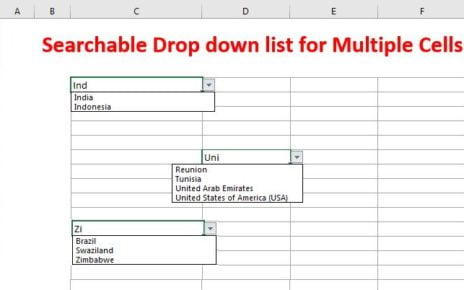
- 📊 Interactive Visuals: Create engaging charts, graphs, and maps to explore sales data effortlessly.
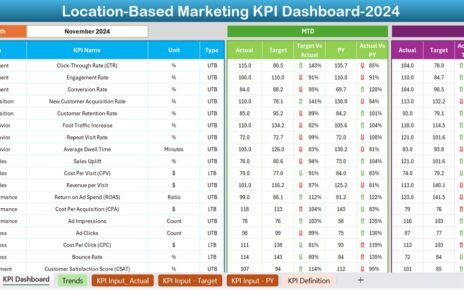
- 🔍 Comprehensive Sales Insights: Track and analyze sales performance with real-time updates and customizable views.
- 🚀 User-Friendly: Simple to use, even for those new to Power View, with step-by-step instructions included.