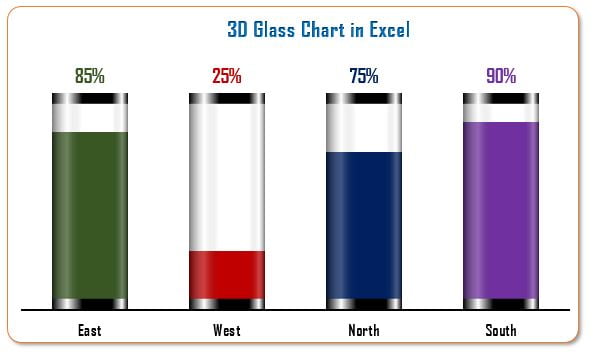
This is an unique and innovative 3D Glass Chart in Excel. This chart is perfect for displaying key performance indicators (KPIs) such as Service Level, Quality Score, and Productivity. In this guide, we will create a 3D Glass Chart to represent Zone Wise Service Level.

Key Features
- Visually Striking Design: The 3D Glass Chart offers a modern and captivating way to present your data, making your KPIs stand out
- Customizable Components: Learn how to create and adjust support columns, gradient fills, and transparency levels to achieve the perfect look for your chart.
- Ready to use Template: This is a ready to use template. Just plugin your data and your chart will be ready.


