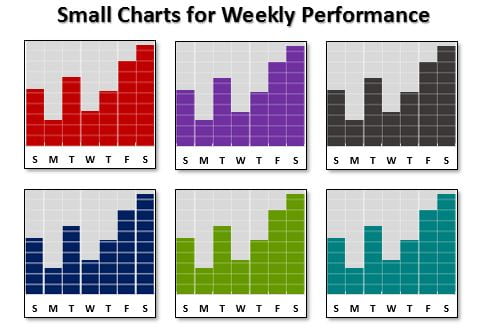
Creating Small Charts for Weekly Performance in Excel allows you to efficiently present data without consuming excessive space on your dashboard. These charts provide a clear, concise way to visualize weekly performance metrics, making your data both accessible and aesthetically pleasing.

Key Features
- Space-saving: Ideal for dashboards with limited space, allowing multiple charts to be displayed compactly.
- Easy to read: Despite their small size, these charts maintain readability and effectively communicate performance data.
- Customization: Offers various formatting options to tailor the charts to your specific needs and preferences.
Read the detailed blog post


