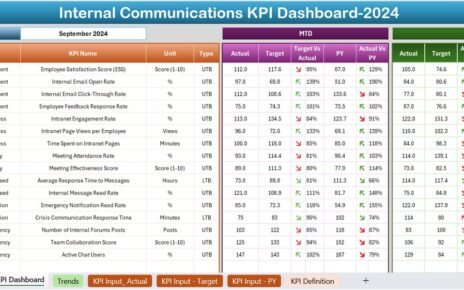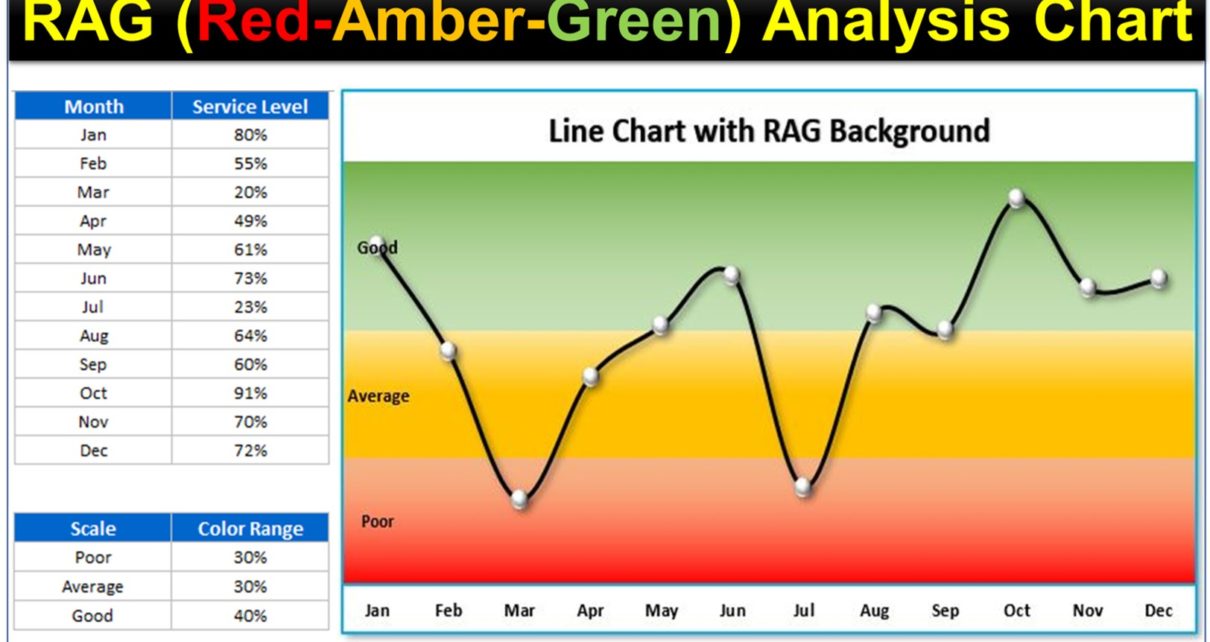
RAG (Red, Amber, and Green) Analysis Chart is an effective tool for performance analysis in Excel. This chart can make your Excel Report more useful Analysis Chart in Excel.
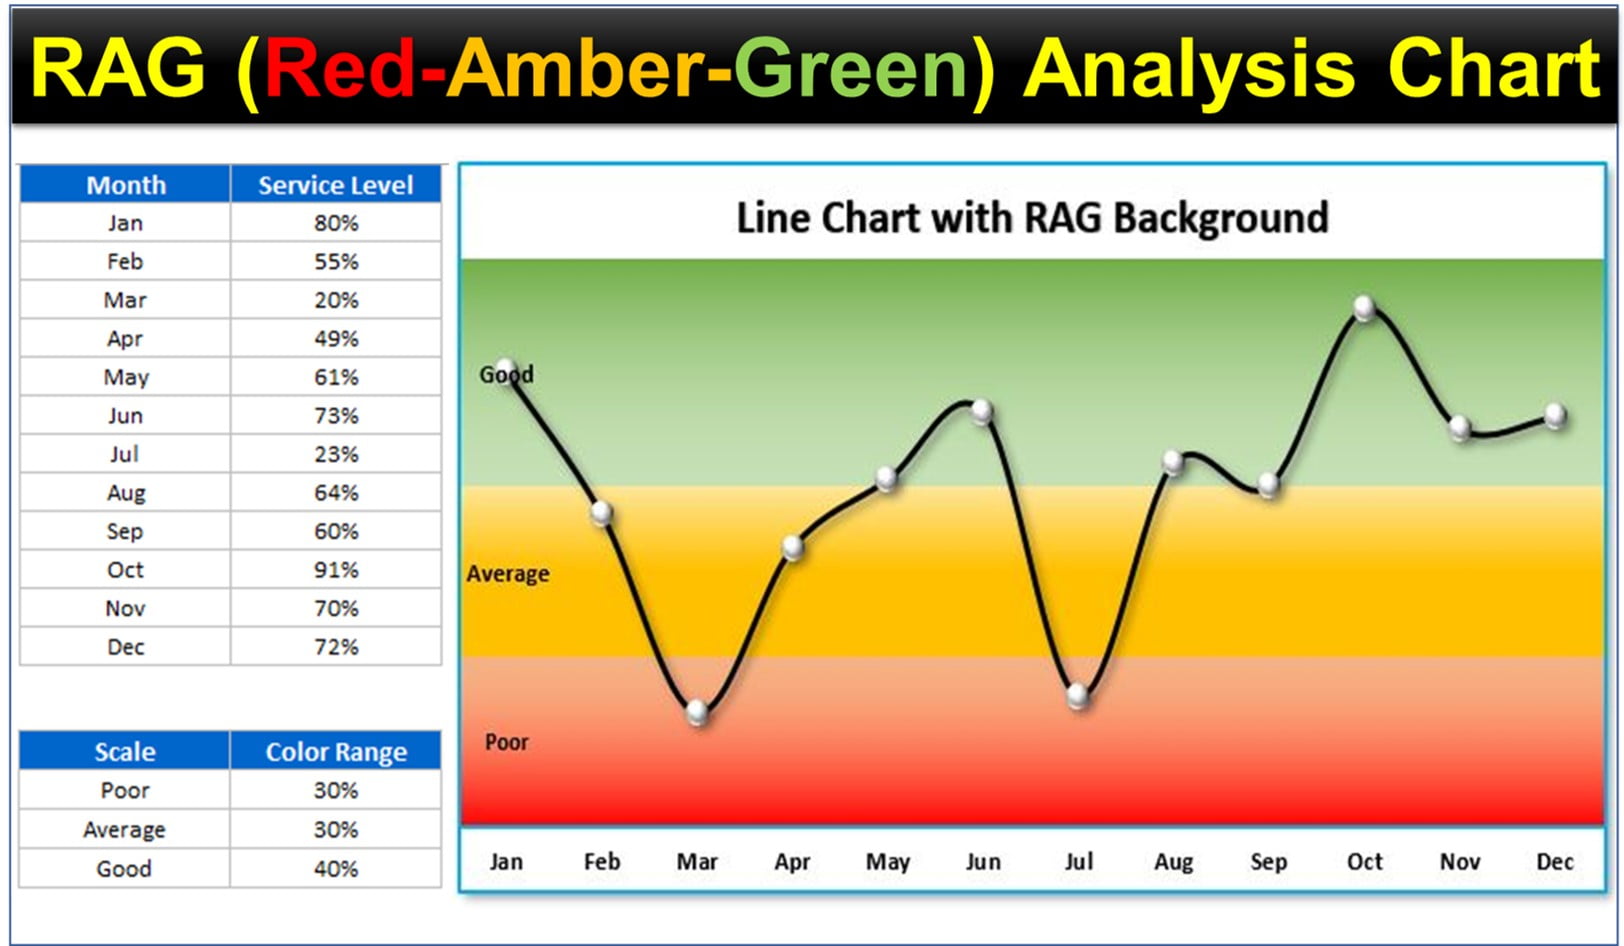
Key Features:
- Dynamic Background Colors: Easily adjust the RAG background colors by modifying the data set, providing clear visual indicators of performance.
- Combined Chart Types: Utilize both stacked column and line charts to create a comprehensive and informative RAG analysis.
- Ready to use Template: This is a ready to use template. You can simply connect your data with this chart.