Home>Download>Highlight the Specific data point in a Line Chart Dynamically
Highlight the data point

Highlight the Specific data point in a Line Chart Dynamically

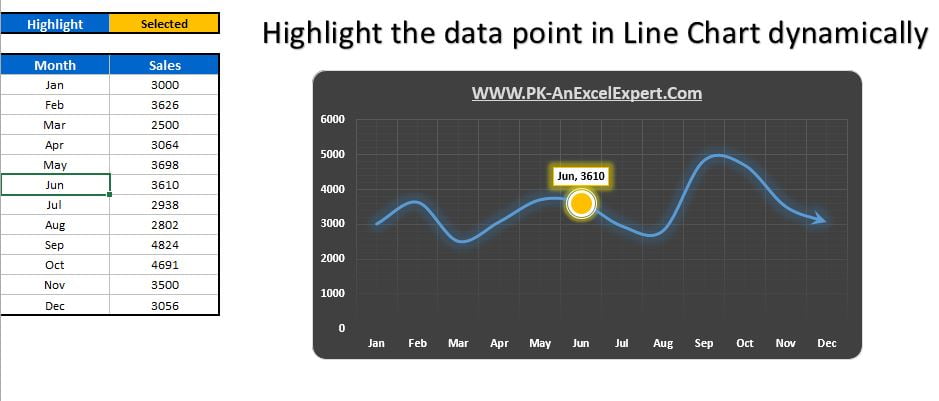
Elevate your business dashboards and presentations with our innovative Excel Line Chart, designed to dynamically highlight specific data points such as Minimum, Maximum, and Selected values. This powerful tool provides a clear, visual emphasis on key metrics, making your data storytelling more impactful and accessible.


Highlight the Specific data point in a Line Chart Dynamically

Key Features:

  • Dynamic Data Point Highlighting: Automatically accentuate Minimum, Maximum, and user-selected data points in your line chart, ensuring significant figures stand out at a glance.
  • Versatile Application: Ideal for use in business dashboards and presentations, our chart enhances data visibility and comprehension across various business contexts.
  • Customizable Features: Tailor the chart to fit your specific needs, with options to modify which data points are highlighted and how they are visually represented, ensuring maximum relevance and clarity.
PK
Meet PK, the founder of PK-AnExcelExpert.com! With over 15 years of experience in Data Visualization, Excel Automation, and dashboard creation. PK is a Microsoft Certified Professional who has a passion for all things in Excel. PK loves to explore new and innovative ways to use Excel and is always eager to share his knowledge with others. With an eye for detail and a commitment to excellence, PK has become a go-to expert in the world of Excel. Whether you're looking to create stunning visualizations or streamline your workflow with automation, PK has the skills and expertise to help you succeed. Join the many satisfied clients who have benefited from PK's services and see how he can take your Excel skills to the next level!
https://www.pk-anexcelexpert.com