Elevate your data presentations with our uniquely designed Lollipop Chart in Excel, incorporating Conditional Formatting in a Lollipop Chart in Excel to deliver instant visual insights into performance against targets. This engaging and informative chart is perfect for showcasing day-wise sales data in a manner that is both visually appealing and immediately understandable.
Key Features:
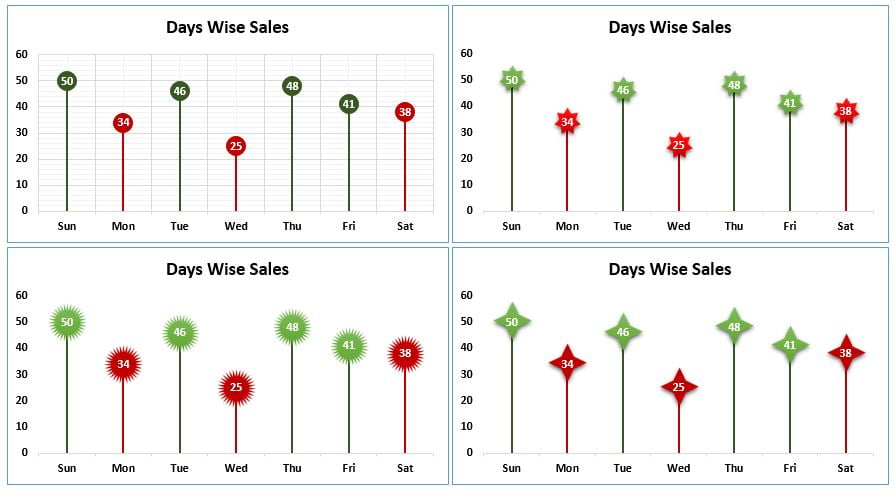
- Conditional Formatting in a Lollipop Chart in Excel: Automatically colors data points in green or red to indicate whether daily sales meet or fall short of the target, providing a quick visual guide to performance.
- Dynamic Updates: Changes in the target value prompt an immediate update in the chart’s color coding, ensuring that your data presentation always reflects the most current figures.
- Multiple Design Variants: Choose from four distinct lollipop chart designs, each with different shapes that add a creative twist to your data visualization efforts.
Conditional Formatting in a Lollipop Chart in Excel