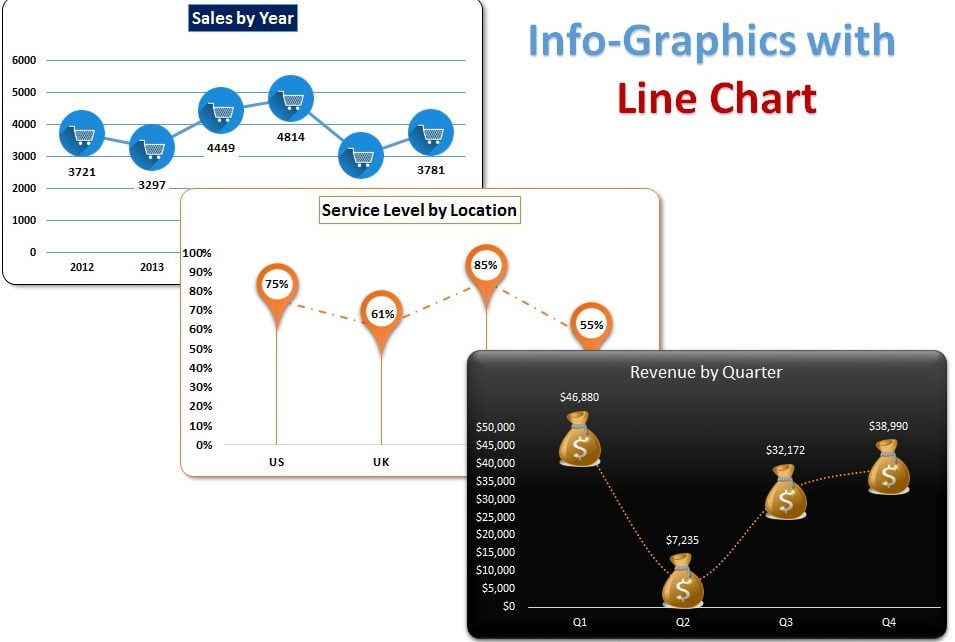
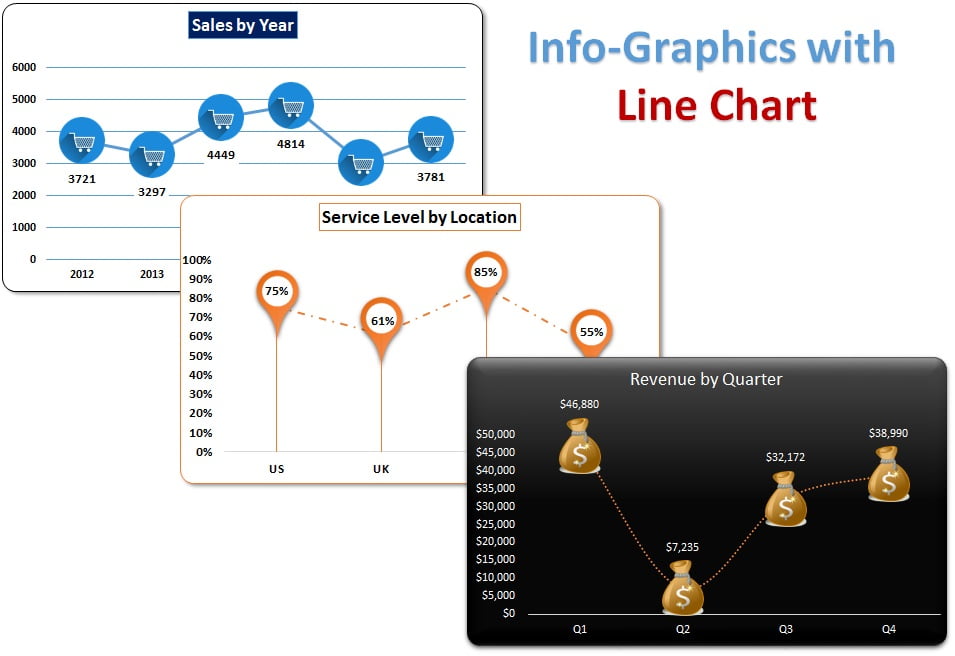
Revitalize your data presentations with our “Infographics with Line Chart” Excel file, a transformative approach to traditional line charts. By integrating vibrant infographics, such as custom icons and illustrations, this product turns standard data visualization into captivating and informative artworks. Suitable for displaying trends in sales, revenue, and service levels, these charts are perfect for reports, presentations, and dashboards.
Key Features:
- Enhanced Visual Appeal: Each line chart is enhanced with custom infographics, making them more engaging and easier to understand at a glance.
- Diverse Applications: From sales by year to service level by location, the charts cover various metrics, each tailored with specific icons like sales karts, money bundles, and location markers to illustrate different data points vividly.
- User-Friendly Customization: Follow simple steps to replicate or modify the charts using your data. Whether you’re adding new icons or adjusting data sets, our guide makes it easy for users of all skill levels.
Read the detailed blog post