Home>Download>3D KPI Indicator in Excel
3D KPI Indicator

3D KPI Indicator in Excel

Harness the power of visualization with our “3D KPI Indicator in Excel,” a dynamic tool designed to effectively display the status of your key performance indicators (KPIs) at a glance. This innovative template uses vivid 3D indicators to represent KPI metrics, making it easier than ever to monitor performance trends and make data-driven decisions.


3D KPI Indicator in Excel

Key Features:

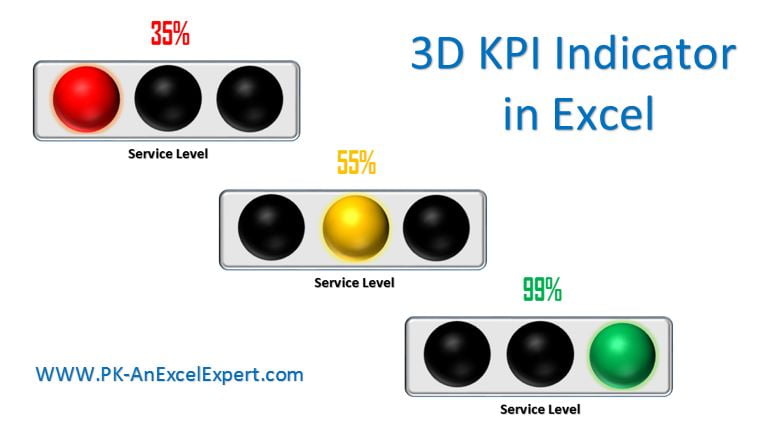
  • Dynamic Color-Coded Indicators: Utilize three solid 3D balls that change color—red, yellow, or green—based on the performance metrics from your data, providing an intuitive visual representation of status levels.
  • Automated Data Integration: Automatically updates service values and indicator colors when the date changes, ensuring real-time accuracy without manual data entry.
  • Seamless Data Linking: Pulls data directly from another worksheet, maintaining a clean and organized dashboard that’s easy to manage and update.
PK
Meet PK, the founder of PK-AnExcelExpert.com! With over 15 years of experience in Data Visualization, Excel Automation, and dashboard creation. PK is a Microsoft Certified Professional who has a passion for all things in Excel. PK loves to explore new and innovative ways to use Excel and is always eager to share his knowledge with others. With an eye for detail and a commitment to excellence, PK has become a go-to expert in the world of Excel. Whether you're looking to create stunning visualizations or streamline your workflow with automation, PK has the skills and expertise to help you succeed. Join the many satisfied clients who have benefited from PK's services and see how he can take your Excel skills to the next level!
https://www.pk-anexcelexpert.com