Home>Download>Comparison infographics in excel
Comparison between two teams

Comparison infographics in excel

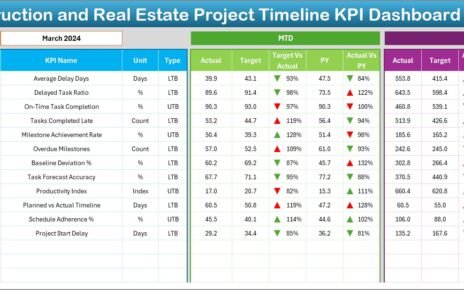
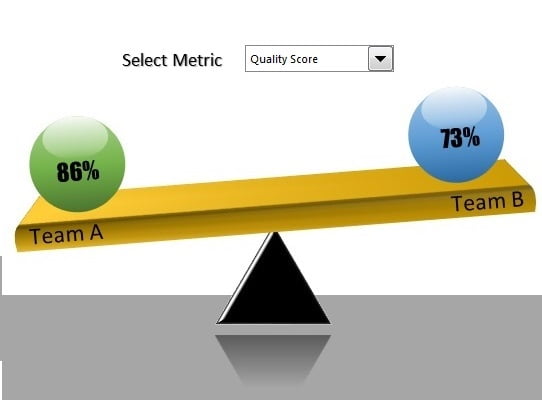
Take your performance analysis to the next level with our “Comparison Infographics in Excel,” designed to provide a clear visual comparison of two teams across multiple metrics. This innovative tool offers a balanced, data-driven approach to performance assessment, featuring interactive elements that enhance user engagement and comprehension.


Comparison infographics in excel

Key Features:

  • Interactive Comparison Tool: Leverages a Form Control Combo Box to allow users to select different metrics for comparison, showing a direct side-by-side visualization of two teams.
  • Dynamic Visual Balance: Uses creatively designed shapes that rotate based on the values entered, visually representing which team is ‘weighing in’ stronger on specific metrics.
  • Customizable Metrics: Easily adaptable for various performance indicators, this infographic can be tailored to specific organizational needs, making it versatile for different analytical purposes.
PK
Meet PK, the founder of PK-AnExcelExpert.com! With over 15 years of experience in Data Visualization, Excel Automation, and dashboard creation. PK is a Microsoft Certified Professional who has a passion for all things in Excel. PK loves to explore new and innovative ways to use Excel and is always eager to share his knowledge with others. With an eye for detail and a commitment to excellence, PK has become a go-to expert in the world of Excel. Whether you're looking to create stunning visualizations or streamline your workflow with automation, PK has the skills and expertise to help you succeed. Join the many satisfied clients who have benefited from PK's services and see how he can take your Excel skills to the next level!
https://www.pk-anexcelexpert.com