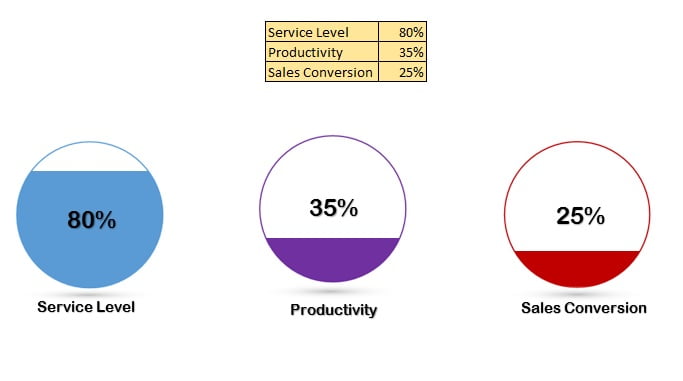
Unlock the potential of your data with our Filling Circle Chart Excel Template. Designed by experts, this visually striking chart offers a clear and effective way to display Key Performance Indicators (KPIs) like Service Level, Quality Score, and Sales Conversion. It’s an innovative tool that blends PowerPoint’s graphical capabilities with Excel’s dynamic data management, providing a seamless and interactive visualization experience.
Key Features of the Filling Circle Chart Excel Template
- Dynamic Data Updates: This chart is fully data-driven, automatically updating as source data changes, ensuring you always have the most current information at your fingertips.
- Versatile KPI Tracking: Customize the chart to monitor various KPIs, making it applicable across different business functions from customer service to sales.
- Integrated PowerPoint Design: Utilizes PowerPoint to enhance visual appeal, merging shapes and column charts for a unique and informative display.