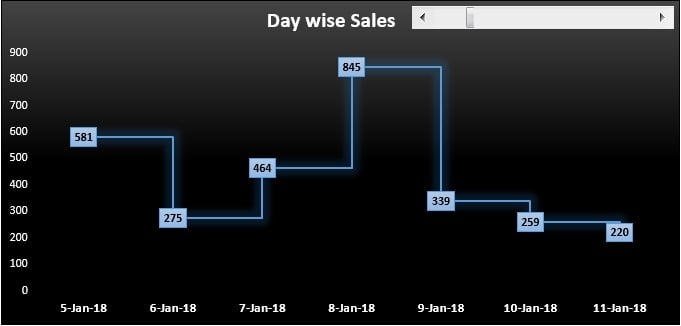
Explore the capabilities of Excel with our new tutorial, “Dynamic Step Chart in Excel.” This paid guide is specifically crafted to teach you how to visualize rolling 7-day sales or price data dynamically. Through a detailed walkthrough, you’ll learn to create a step chart that updates automatically with your data, perfect for tracking trends over time in a visually compelling manner.
Key Features:
- Real-Time Data Interaction: Incorporate a scroll bar form control to navigate through different time periods, allowing for a dynamic view of rolling data such as weekly sales or price changes.
- Automated Data Handling: Learn to use advanced Excel functions and formulas to automatically generate dates and sales data, ensuring your chart remains up-to-date with minimal manual input.
- Customized Visualization: Tailor your chart with custom data labels, color styles, and formatting options to enhance readability and presentation aesthetics, making it suitable for business reports and presentations.