Are you looking to calculate averages in Excel but only want to include data that meets certain conditions? Well, you’re in luck! In this blog post, we’re going to show you how to use the AVERAGEIFS formula in Excel with a real-life example. By the time you finish reading, you’ll have all the tools you need to master this handy function!
What Does the AVERAGEIFS Function Do?
Let’s start with the basics. The AVERAGEIFS function in Excel calculates the average of a range of numbers—but here’s the magic part—it only includes numbers that meet multiple criteria. This means you can be specific about what data to include in your average.
So, instead of manually filtering your data, you can let Excel do the hard work for you!
How Does the AVERAGEIFS Formula Work?
Before we dive into the example, let’s quickly go over the formula itself. Don’t worry, it’s easier than it looks!
=AVERAGEIFS (average range, criteria_range1, criteria1, [criteria_range2, criteria2], …)
Here’s what each part means:
- average range: This is the range of cells you want to average.
- criteria_range1: The range where you want to check your first condition.
- criteria1: The actual condition for criteria_range1 (what you’re looking for).
- criteria_range2, criteria2: (Optional) You can add more criteria if you need to!
Now, let’s move on to a real-life example to see this formula in action.
Step-by-Step Example: Setting Up Your Data
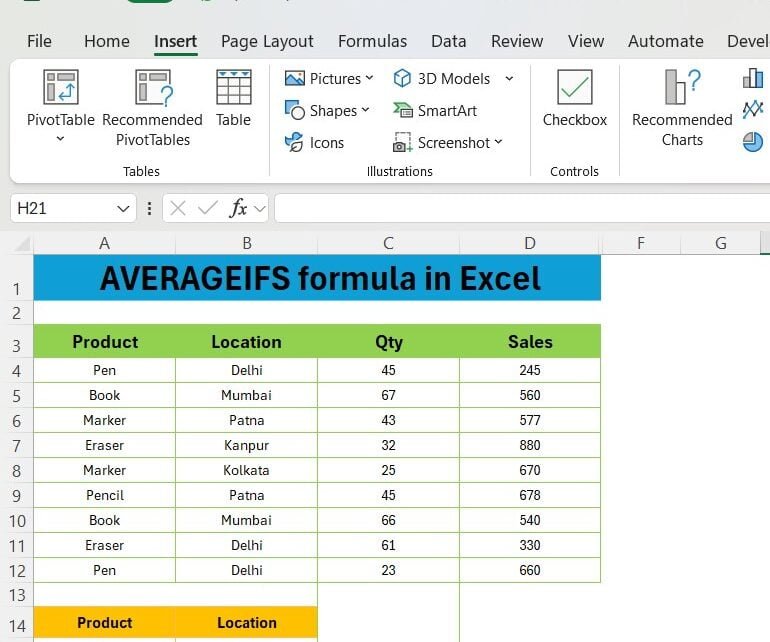
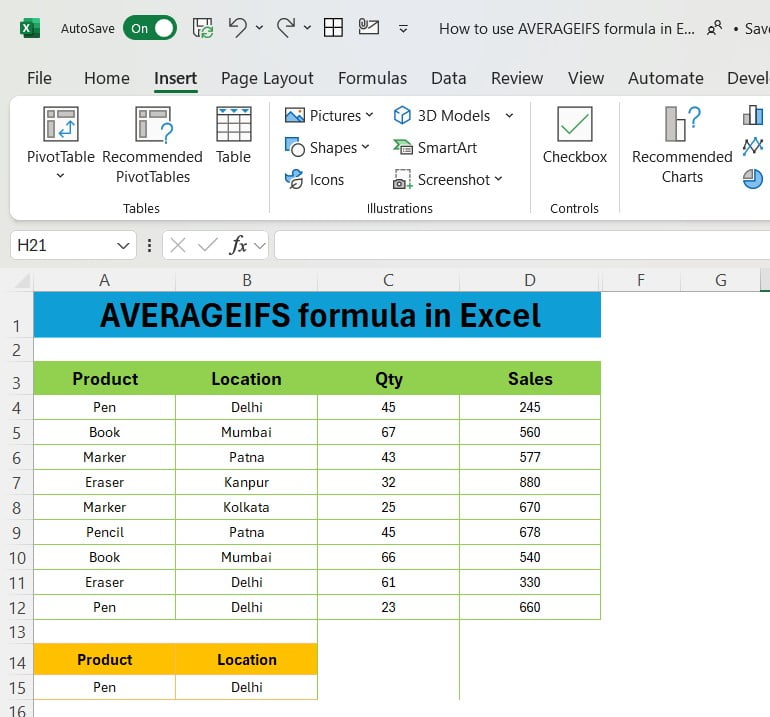
To help you understand this better, let’s imagine you run a small business. You’re keeping track of your product sales across different locations, and you have the following data:
As you can see, you have four columns: Product, Location, Quantity (Qty), and Sales. Now, let’s say you want to find out the average sales of Pens sold specifically in Delhi. Sounds like a task for the AVERAGEIFS function!
Using the AVERAGEIFS Formula to Solve the Problem
Here’s how we can solve this:
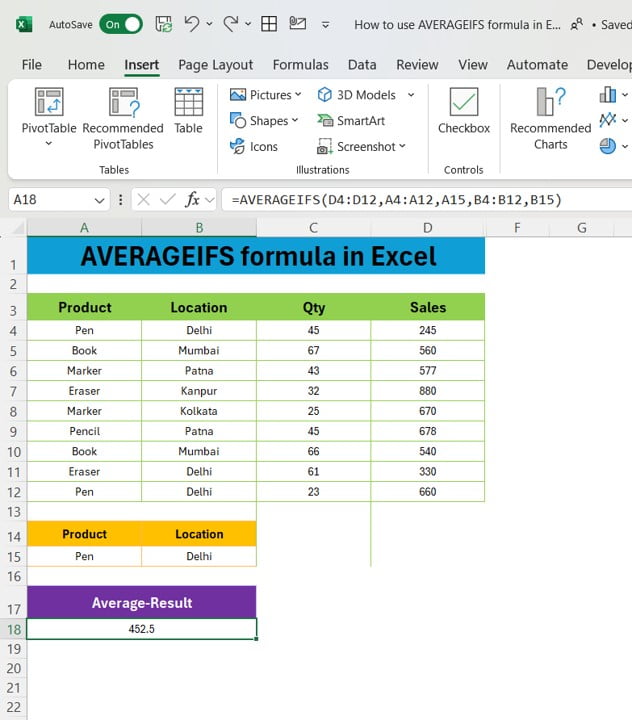
We’ll use the AVERAGEIFS formula to find the average sales for “Pen” in “Delhi” by writing the following formula:
=AVERAGEIFS (D3:D12, A3:A12, “Pen”, B3:B12, “Delhi”)
Here’s a quick breakdown of the formula:
- D3: This is the range of sales data that we want to average.
- A3: This is the range where the product names (like Pen, Book, etc.) are listed.
- “Pen”: This is the product we’re looking for.
- B3: This is the range that holds the locations.
- “Delhi”: This is the specific location we’re filtering by.
The Result: Average Sales of Pens in Delhi
Now that you’ve entered the formula, Excel will calculate the average for you. For our data, the result will be
That’s right! The average sales for Pens sold in Delhi is 452.5.
Why Should You Use the AVERAGEIFS Function?
You might be wondering, why go through the trouble of using the AVERAGEIFS function? Well, here are a few great reasons:
- Saves Time: 🕒 You don’t have to manually filter through your data to calculate the average. The formula does it for you in a matter of seconds.
- Multiple Criteria: 🎯 With AVERAGEIFS, you can apply as many conditions as you need. This is especially helpful when you’re working with large datasets.
- Accurate Calculations: ✅ It ensures that you only include the data that fits your exact requirements, making your analysis more precise.
Final Thoughts: Try It Yourself!
The AVERAGEIFS function is a game-changer, especially if you deal with large sets of data and need specific averages based on multiple conditions. Why not give it a try on your own data? You’ll see just how easy and helpful this function can be.
And if you’d like a more detailed tutorial, check out our YouTube video where we walk you through the steps in real time!
Visit our YouTube channel to learn step-by-step video tutorials
View this post on Instagram
Click hare to download the practice file