In today’s competitive manufacturing industry, tracking and managing Key Performance Indicators (KPIs) is crucial for maintaining efficiency, reducing costs, and improving overall output. A Manufacturing KPI Dashboard provides an easy-to-use, centralized system for monitoring critical metrics, ensuring your manufacturing processes stay on track.
This article will walk you through the Manufacturing KPI Dashboard, its key features, advantages, opportunities for improvement, and best practices. We’ll also answer some frequently asked questions (FAQs) to help you make the most of this powerful tool.
What is a Manufacturing KPI Dashboard?
A Manufacturing KPI Dashboard is a tool that consolidates and visualizes key metrics for manufacturers. KPIs are used to measure performance in specific areas like production, efficiency, quality, and financial metrics. This dashboard allows companies to monitor these KPIs in real-time and adjust strategies as needed to meet goals.
By providing detailed information about month-to-date (MTD) and year-to-date (YTD) numbers, as well as targets and historical data, manufacturers can improve decision-making and optimize performance.
Key Features of the Manufacturing KPI Dashboard
Our Manufacturing KPI Dashboard offers a ready-to-use template packed with powerful features. Let’s break them down:
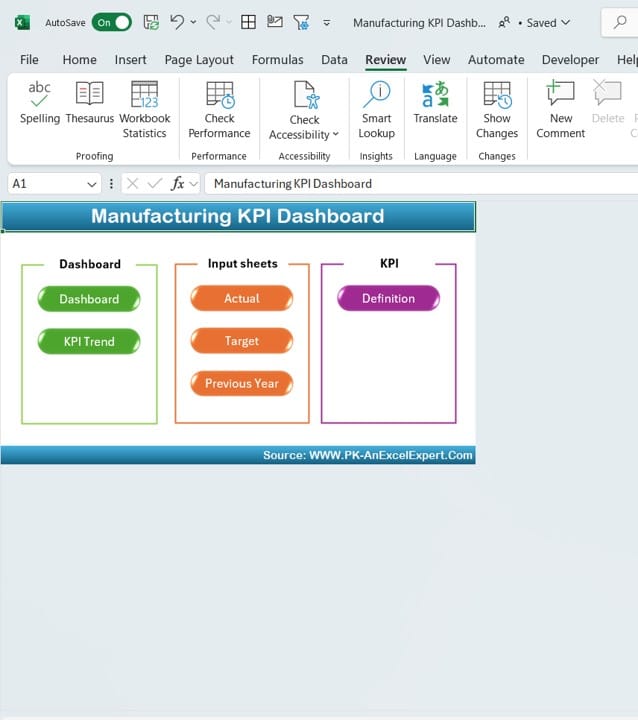
Home Sheet
Click to buy Manufacturing KPI Dashboard
This serves as the index sheet for the dashboard. The home sheet features six buttons that allow users to quickly navigate to different sheets within the workbook, making it highly user-friendly.
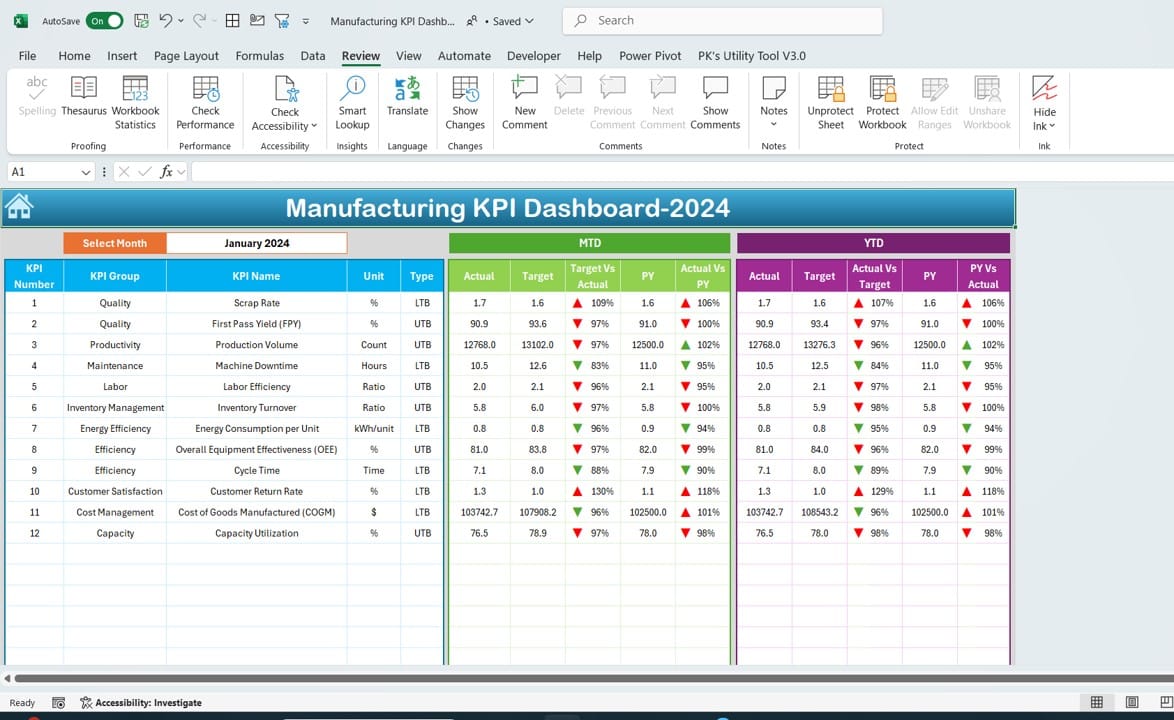
Dashboard Sheet Tab
Click to buy Manufacturing KPI Dashboard
The Dashboard Sheet is the core of this system. It shows all relevant KPIs and allows users to select the month using a drop-down menu in range D3. When a month is selected, the dashboard instantly updates, displaying metrics such as:
- MTD Actuals
- MTD Targets
- Previous Year Data
- Target vs Actual Comparison
- PY vs Actual Comparison with conditional formatting arrows indicating upward or downward trends
It also displays YTD Actuals, Targets, and Previous Year Data for the selected KPIs, providing a clear view of long-term performance.
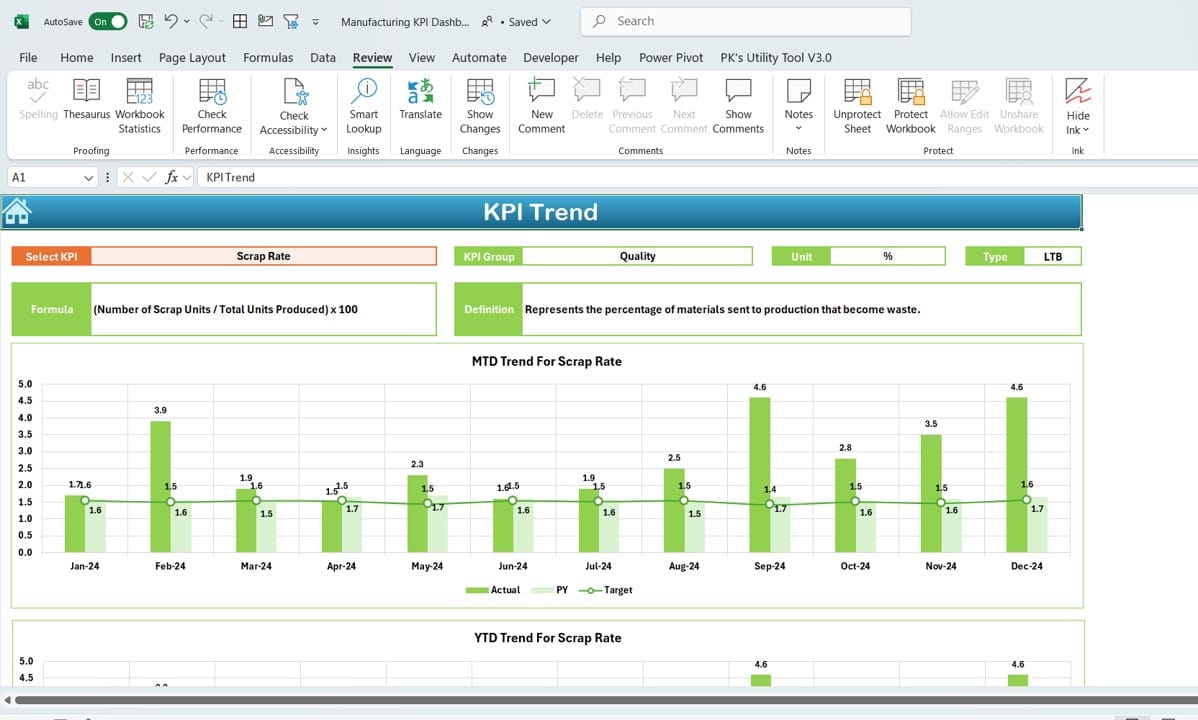
KPI Trend Sheet Tab
Click to buy Manufacturing KPI Dashboard
This sheet allows users to analyses trends for specific KPIs. By selecting a KPI from the drop-down list at range C3, users can view:
- KPI Group
- Unit of KPI
- Type of KPI (whether lower or higher values are better)
- KPI Formula
- KPI Definition
The sheet also provides trend charts for both MTD and YTD data for actuals, targets, and prior year values, giving a clear visual representation of performance over time.
Actual Numbers Input Sheet
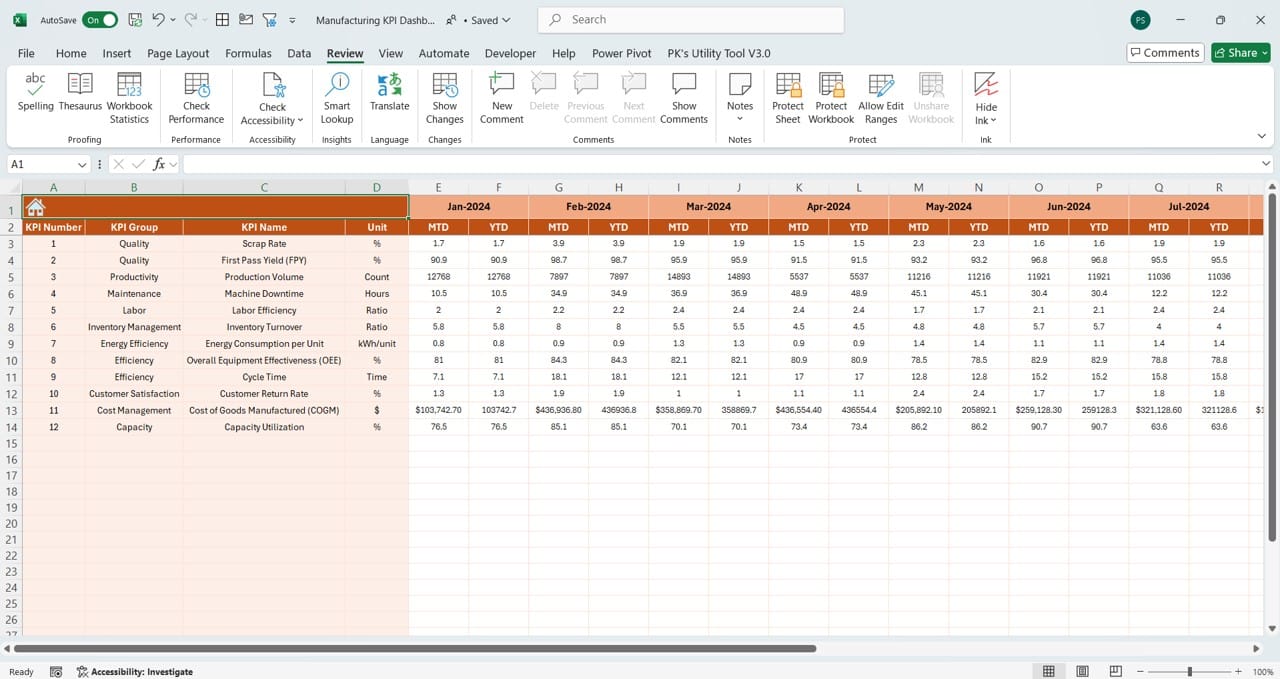
Click to buy Manufacturing KPI Dashboard
To keep the dashboard up-to-date, you’ll need to enter actual performance numbers in this sheet. Inputting actual data for both YTD and MTD is made simple with a drop-down in range E1, allowing users to easily switch between months.
Target Sheet Tab
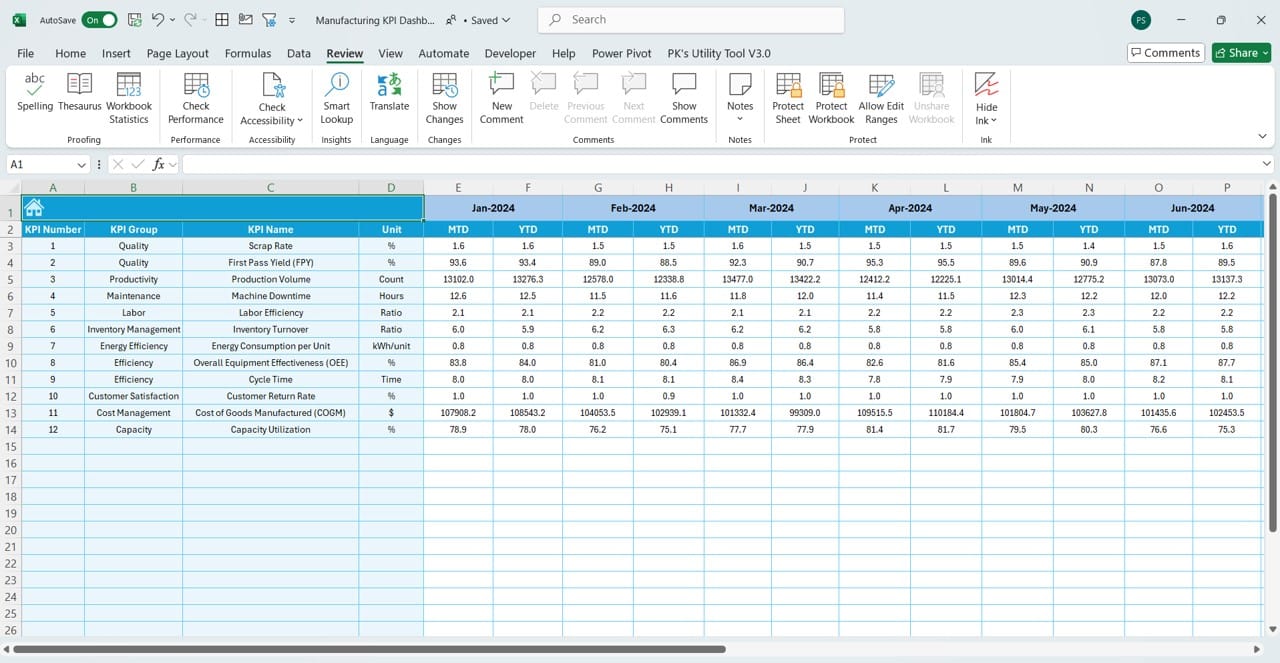
Click to buy Manufacturing KPI Dashboard
Here, you enter target numbers for each KPI, both MTD and YTD, to compare actual performance with targets.
Previous Year Number Sheet Tab
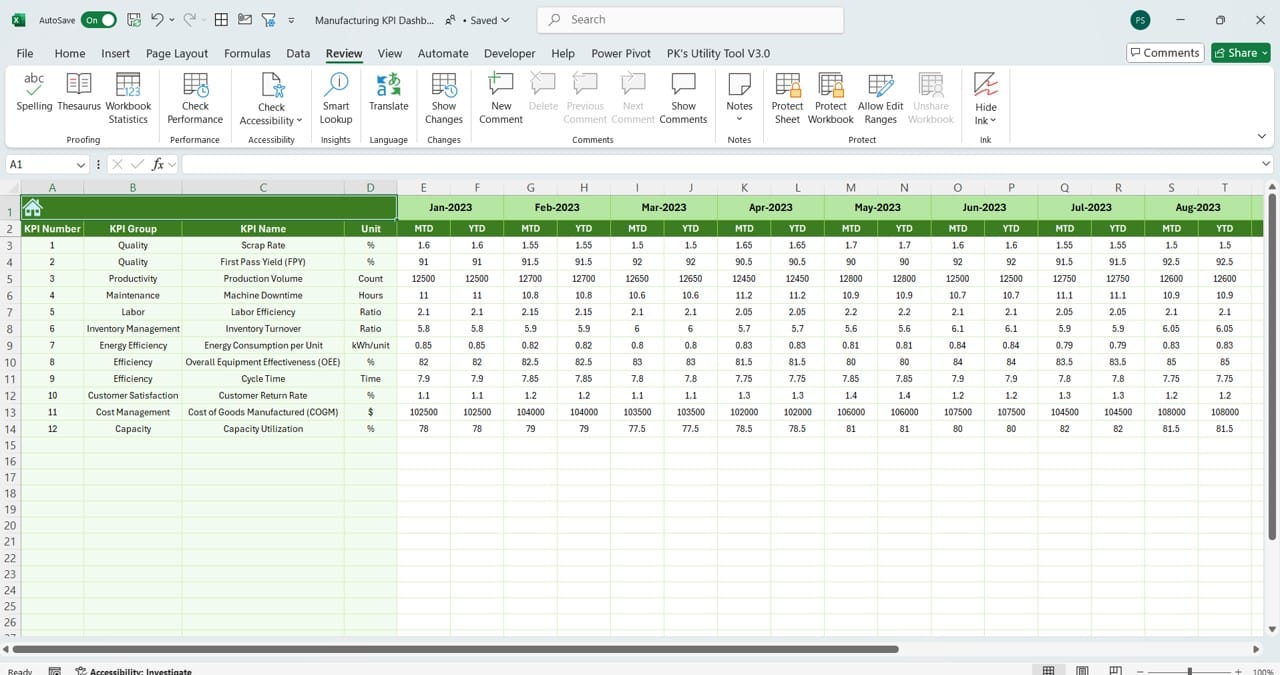
Click to buy Manufacturing KPI Dashboard
Historical performance is critical for meaningful comparisons. This sheet allows you to enter prior year data, giving you a clear comparison between current and past performance metrics.
KPI Definition Sheet Tab
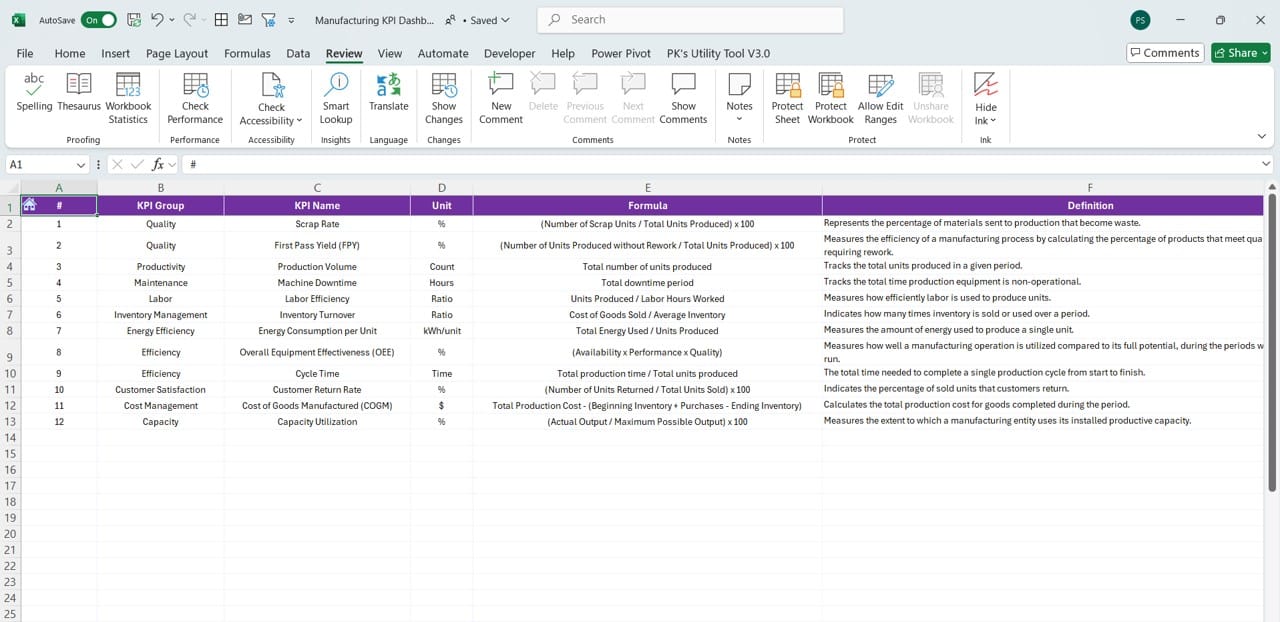
The KPI Definition Sheet allows users to define each KPI by entering the KPI Name, Group, Unit, Formula, and a detailed Definition. This sheet ensures all team members are on the same page when interpreting KPIs.
Click to buy Manufacturing KPI Dashboard
Advantages of Using a Manufacturing KPI Dashboard
There are several advantages to implementing a Manufacturing KPI Dashboard:
-
Real-Time Performance Monitoring
The dashboard provides real-time updates, allowing decision-makers to take immediate action based on up-to-date data. You can see how the actual performance stacks up against targets and make adjustments as needed.
-
Improved Decision Making
With all the key metrics at your fingertips, you can make informed decisions faster. The dashboard helps prioritize actions by highlighting performance gaps and areas needing attention.
-
Enhanced Visibility Across Teams
Sharing KPI data across teams ensures everyone understands performance metrics and goals. This transparency improves collaboration and accountability.
-
Better Resource Management
By tracking KPIs such as production efficiency, downtime, and scrap rates, you can optimize resource usage and reduce waste, saving costs in the long run.
-
Historical Data for Benchmarking
The ability to track and compare performance against previous years allows businesses to identify long-term trends, assess the effectiveness of strategies, and forecast future performance.
Best Practices for Using a Manufacturing KPI Dashboard
To maximize the effectiveness of your Manufacturing KPI Dashboard, follow these best practices:
- Regularly Update Data: Ensure that data is updated regularly, preferably on a daily or weekly basis. This keeps your dashboard accurate and helps maintain real-time performance tracking.
- Set Realistic Targets: It’s important to set KPIs that are ambitious but attainable. Unrealistic targets can demotivate teams and lead to poor performance evaluations.
- Train Your Team: Make sure that all relevant team members are familiar with how to use the dashboard, interpret data, and adjust based on insights.
- Use Visual Cues Effectively: Incorporate conditional formatting such as up/down arrows or color coding to quickly indicate whether metrics are on track, improving the usability of the dashboard.
- Analyze Trends, Not Just Snapshots: While current performance is important, always consider the longer-term trends provided by your YTD and historical data to make more strategic decisions.
Conclusion
A Manufacturing KPI Dashboard is an essential tool for any company looking to improve its production processes, optimize performance, and reduce waste. By consolidating all critical KPIs into a single dashboard, manufacturers gain visibility into real-time performance, improve decision-making, and foster team collaboration.
With its various sheets for tracking actual numbers, targets, and trends, this dashboard is a powerful tool for ensuring your manufacturing operations are running smoothly and efficiently.
Frequently Asked Questions (FAQs)
What is the main purpose of a Manufacturing KPI Dashboard?
A Manufacturing KPI Dashboard helps monitor and measure key performance indicators within manufacturing processes. It provides real-time insights into production efficiency, quality control, and financial metrics.
How can I customize the KPI dashboard to fit my manufacturing process?
You can customize the dashboard by defining your own KPIs, adjusting target numbers, and incorporating additional metrics that align with your specific manufacturing needs.
Can I automate data entry in the Manufacturing KPI Dashboard?
Yes, data entry can be automated by integrating your dashboard with ERP or other data management systems. This saves time and minimizes human errors.
How often should I update the data in my KPI Dashboard?
For best results, update your dashboard daily or weekly. Regular updates help you monitor real-time performance and make quicker, more informed decisions.
What are some common KPIs tracked in a Manufacturing Dashboard?
Common KPIs include production volume, downtime, on-time delivery, scrap rate, overall equipment effectiveness (OEE), and yield rate.
This article ensures that users understand the significance of a Manufacturing KPI Dashboard, its key features, and how it can be used to track, analyses, and improve performance in a manufacturing setup.
Let me know if any adjustments are needed!
Visit our YouTube channel to learn step-by-step video tutorials
Watch the step-by-step video tutorial:
Click to buy Manufacturing KPI Dashboard