A General Management KPI Dashboard serves as a powerful tool for business leaders, enabling effective decision-making through the visualization of key performance metrics. This dashboard provides an easy-to-use template to monitor performance and track progress against targets. In this article, we’ll walk you through the essential features, advantages, areas for improvement, best practices, and answers to frequently asked questions regarding a General Management KPI Dashboard.
Click to buy General Management KPI Dashboard
What is a General Management KPI Dashboard?
A General Management KPI Dashboard is an all-in-one visual tool that aggregates important business metrics. It empowers managers by offering real-time insights into both financial and non-financial KPIs (Key Performance Indicators). By consolidating various data points across different business functions, this dashboard helps businesses monitor their performance efficiently and make data-driven decisions.
Click to buy General Management KPI Dashboard
Key Features of the General Management KPI Dashboard
This dashboard template comprises seven worksheets, each designed to manage different data sets and metrics seamlessly. Let’s explore the unique features of each sheet in detail:
Home Sheet
Click to buy General Management KPI Dashboard
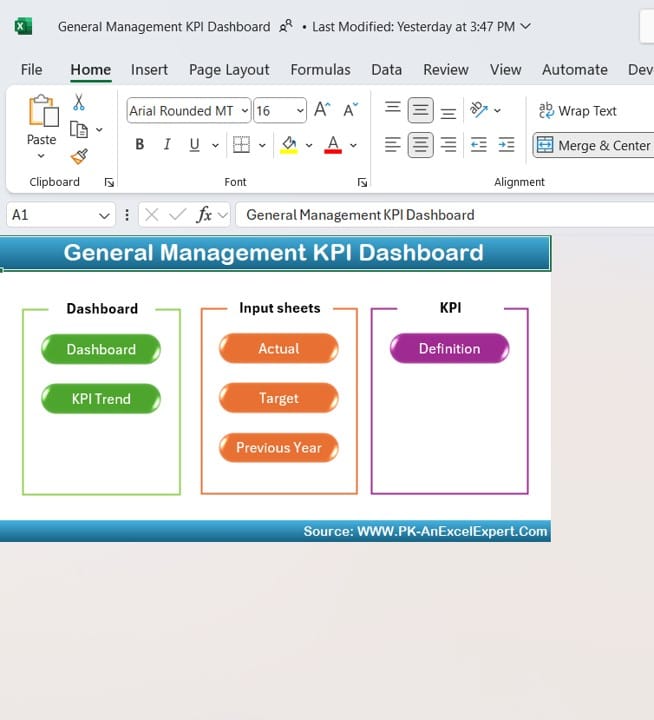
- The Home sheet serves as the index page of the dashboard.
- It provides six navigational buttons to quickly jump to specific sheets.
- This tab helps streamline navigation, saving time when accessing critical data.
Dashboard Sheet Tab

Dashboard Sheet
Click to buy General Management KPI Dashboard
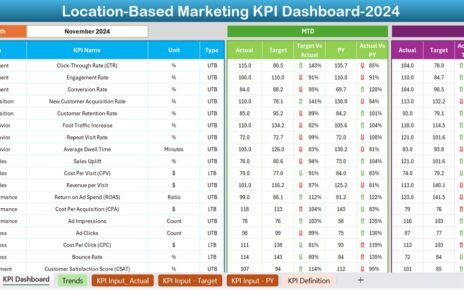
- This is the main dashboard that consolidates all KPI metrics into one visual space.
- You can select the desired month from a drop-down menu (Cell D3), which updates the dashboard’s data dynamically.
- It shows MTD (Month-To-Date) Actuals, Targets, and Previous Year (PY) Data.
- Conditional formatting with up/down arrows highlights performance trends by comparing Target vs. Actual and PY vs. Actual values.
- Additionally, YTD (Year-To-Date) numbers are displayed with similar trend comparisons.
KPI Trend Sheet Tab

KPI Trend
Click to buy General Management KPI Dashboard
- This sheet provides KPI trends over time for a specific metric.
- You can select a KPI from a drop-down menu in Cell C3, and the relevant information will appear.
It displays:
- KPI Group
- Unit of KPI
- KPI Type (e.g., “Lower the Better” or “Upper the Better”)
- Formula used for the KPI calculation
- Definition and description of the KPI
- MTD and YTD trend charts showcase the Actual, Target, and PY performance visually.
Actual Numbers Input Sheet
Click to buy General Management KPI Dashboard
Click to buy General Management KPI Dashboard
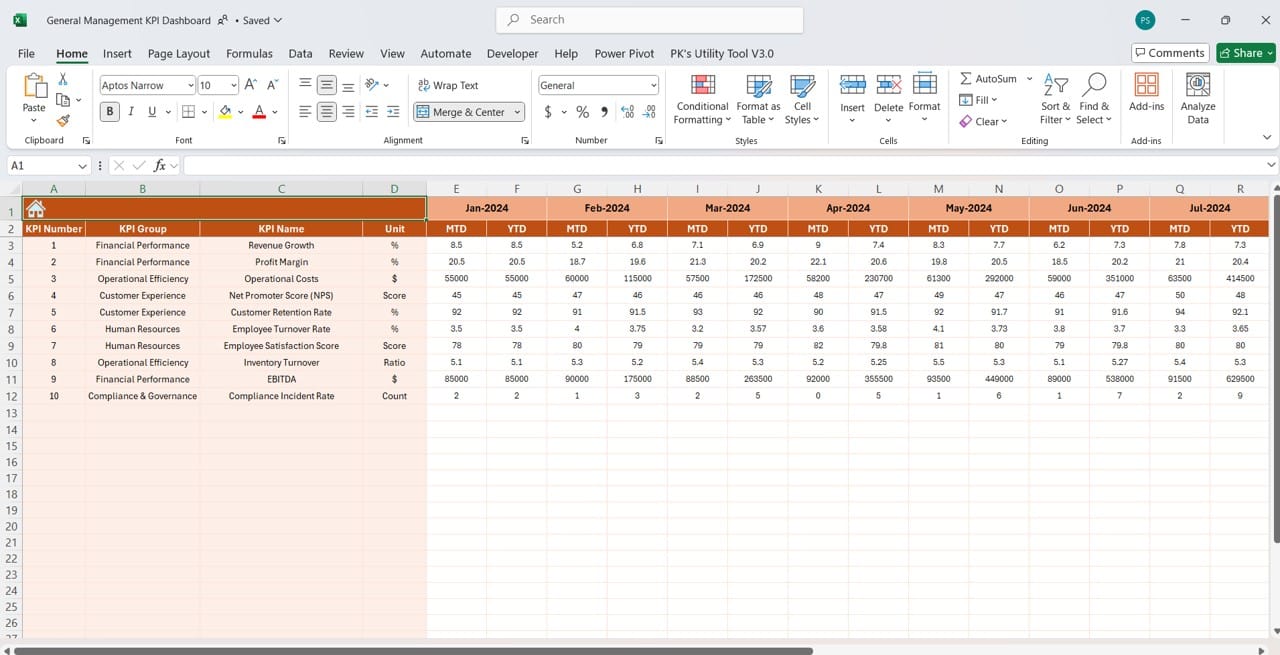
- This sheet is where actual performance data is entered for each KPI.
- Change the month from Cell E1 and input the first month of the year to align with your reporting period.
- Accurate data entry here ensures the dashboard reflects the latest performance metrics.
Target Sheet Tab

Target Sheet
Click to buy General Management KPI Dashboard
- In this sheet, you can set monthly and yearly targets (MTD and YTD) for each KPI.
- Defining realistic targets helps track progress and align efforts toward business goals.
Previous Year Numbers Sheet Tab

Previous Year Numbers
Click to buy General Management KPI Dashboard
- Enter historical data from the previous year in this sheet.
- This data is essential for year-over-year comparisons and performance analysis.
KPI Definition Sheet Tab

KPI Definition
Click to buy General Management KPI Dashboard
- This sheet stores the details for each KPI, including its name, group, unit, formula, and definition.
- It ensures that everyone in the organization understands the KPIs being tracked and their relevance.
Advantages of Using a General Management KPI Dashboard
- Centralized Data Visualization: This dashboard consolidates multiple metrics in one place, reducing the time spent on manual reporting.
- Real-Time Insights: The dynamic dropdowns allow users to monitor MTD and YTD progress effortlessly.
- Enhanced Decision-Making: With clear performance trends, managers can make data-driven decisions aligned with strategic goals.
- Improved Accountability: Tracking targets versus actuals helps assign accountability to specific business functions.
- Year-over-Year Comparison: Historical data enables organizations to assess their growth trajectory effectively.
Opportunities for Improvement in the General Management KPI Dashboard
- Automation of Data Entry: Automating the data input process can minimize human errors and save time.
- Advanced Data Integration: Integrating this dashboard with other tools like Power BI or Excel Macros can unlock advanced analytics features.
- Interactive Visuals: Adding more interactive elements, such as slicers and charts, will enhance user engagement.
- Customization Options: Allowing more flexibility to add custom KPIs and metrics can cater to diverse business needs.
- Performance Alerts: Implementing automated email alerts for deviations from targets will keep teams proactive.
Click to buy General Management KPI Dashboard
Best Practices for Using the General Management KPI Dashboard
- Define Clear KPIs: Ensure that all KPIs are specific, measurable, and aligned with business objectives.
- Regular Data Updates: Update the dashboard periodically to reflect the latest performance metrics.
- Utilize Conditional Formatting: Leverage visual cues like arrows and color coding to highlight performance trends.
- Encourage Collaboration: Use the dashboard as a communication tool to foster cross-functional collaboration.
- Monitor Trends Consistently: Analyses both MTD and YTD trends to understand the business’s seasonal performance patterns.
Conclusion
The General Management KPI Dashboard is an essential tool for businesses aiming to stay ahead in today’s competitive environment. It offers a holistic view of the organization’s performance, helping managers make informed decisions and track progress toward goals. This template simplifies reporting by centralizing data and providing dynamic insights through intuitive dropdowns and trend charts. With a structured data entry process and a clear overview of both past and current performance, this dashboard is a must-have for efficient business management.
Frequently Asked Questions (FAQs)
Q. How do I use the drop-down feature to select a month in the dashboard?
The drop-down to select the month is in Cell D3 of the dashboard sheet. Selecting a month will automatically update the dashboard with the relevant MTD and YTD data.
Q. What is the purpose of the KPI Trend Sheet?
The KPI Trend Sheet displays the MTD and YTD performance trends for a selected KPI, along with essential details such as the KPI group, formula, and type (Lower/Upper the Better).
Q. Can I customize the KPIs in the dashboard?
Yes, the KPI Definition Sheet allows you to add or modify KPIs, including their formulas, units, and descriptions, to align with your business requirements.
Q. How can I track performance against previous years?
You can enter previous year data in the “Previous Year Number Sheet Tab.” This data is automatically compared with current performance on the dashboard using conditional formatting.
Q. What is the best way to ensure accurate data entry?
To ensure accuracy, assign responsibility to specific team members for entering data into the Actual Numbers Input and Target Sheets. Also, consider automating data entry to reduce errors.
This General Management KPI Dashboard offers unparalleled visibility into your business performance. By following the best practices outlined in this article, you can unlock the full potential of this tool and stay ahead of your business goals.
Click to buy General Management KPI Dashboard
Visit our YouTube channel to learn step-by-step video tutorials
Click to buy General Management KPI Dashboard