Managing Digital Marketing KPI Dashboard campaigns can feel overwhelming without the right tools. A Digital Marketing KPI Dashboard in Excel provides a practical way to track, analyze, and manage the key performance indicators (KPIs) for your business. This ready-to-use dashboard template simplifies reporting by displaying the essential metrics in a well-organized, visually appealing format. In this article, we’ll walk you through its features, best practices, advantages, and areas for improvement Digital Marketing KPI Dashboard.
Click to buy Digital Marketing KPI Dashboard in Excel
Key Features of the Digital Marketing KPI Dashboard
This Excel template has seven worksheet tabs, each serving a specific purpose. Let’s explore them in detail:
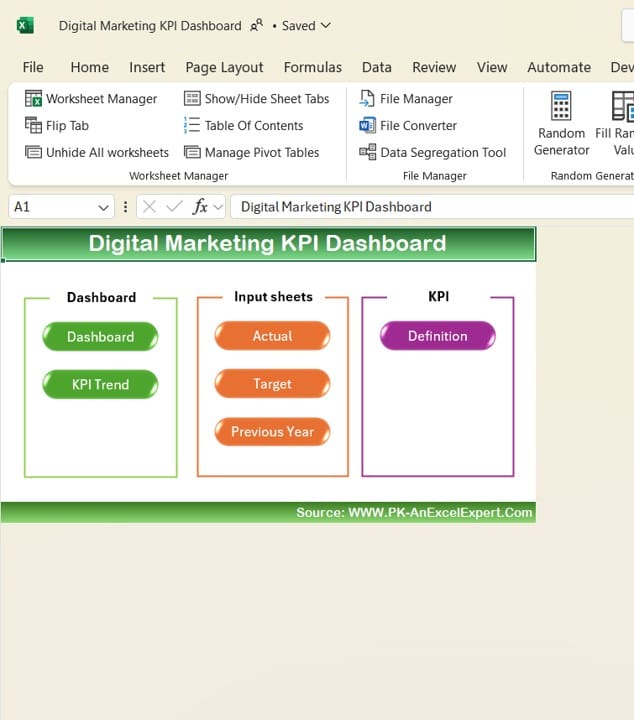
Home Sheet
Click to buy Digital Marketing KPI Dashboard in Excel
The Home sheet acts as an index or navigation page. It contains six buttons, each of which takes you directly to its respective worksheet. This ensures easy access to different sections without the need to scroll or search within the workbook.
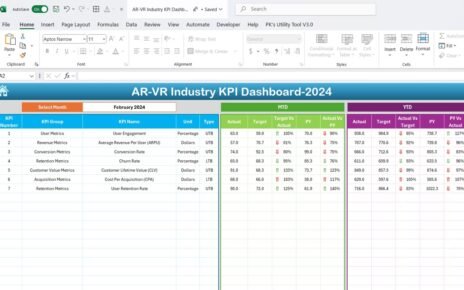
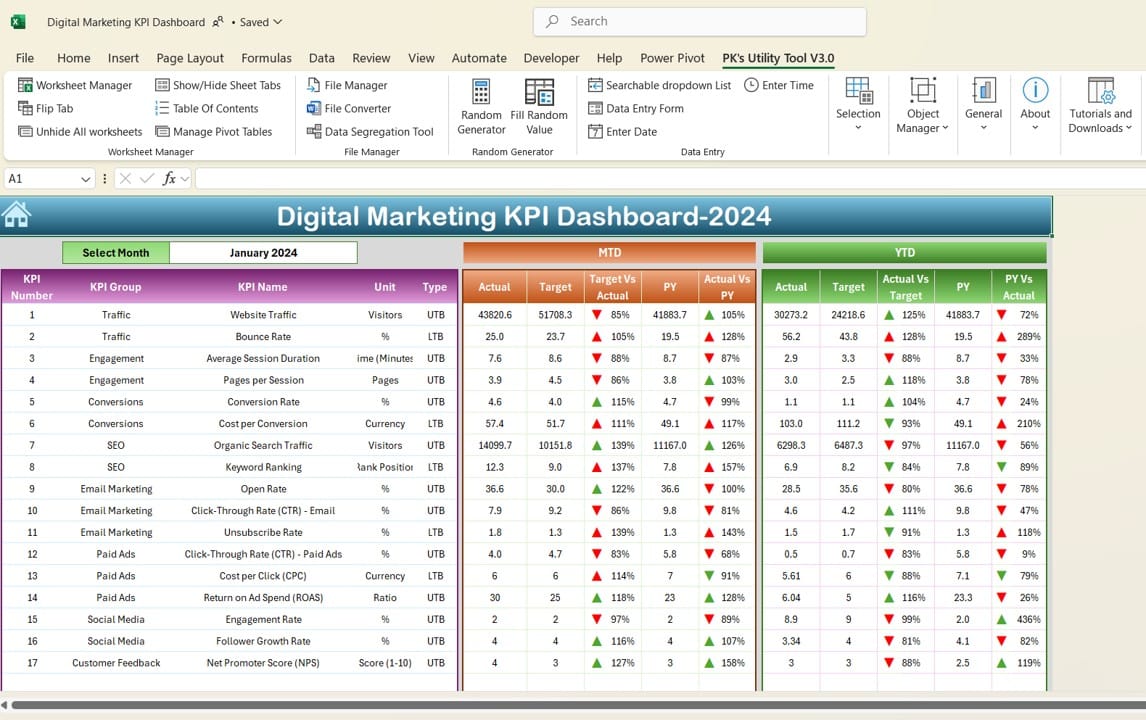
Dashboard Sheet Tab
Click to buy Digital Marketing KPI Dashboard in Excel
The Dashboard sheet tab is the core of this template. It provides an overview of all KPIs, both for Month-to-Date (MTD) and Year-to-Date (YTD) periods.
- MTD Data: Displays the actual performance, targets, and previous year’s values for the selected month. You can choose the month from the drop-down menu in cell D3, and the entire dashboard updates accordingly.
- YTD Data: Shows cumulative performance across the year, comparing it with targets and the previous year’s numbers.
- Visual Indicators: This tab uses conditional formatting with upward and downward arrows to indicate whether the performance is meeting, exceeding, or falling short of expectations.
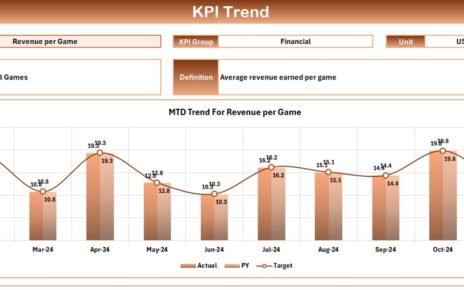
KPI Trend Sheet Tab

KPI Trend Sheet
Click to buy Digital Marketing KPI Dashboard in Excel
- The KPI Trend sheet tab offers a dynamic way to analyze individual KPIs.
- Drop-down Selection: Choose the KPI to analyze from the drop-down menu in cell C3.
- KPI Grouping and Metrics: This tab highlights key information such as the KPI group, unit, performance type (whether a higher or lower value is better), and the KPI formula with its definition.
- Trend Charts: Track both MTD and YTD trends through charts for actual, target, and previous year performance, helping you spot emerging patterns.
Actual Numbers Input Sheet

Actual Numbers Input Sheet
Click to buy Digital Marketing KPI Dashboard in Excel
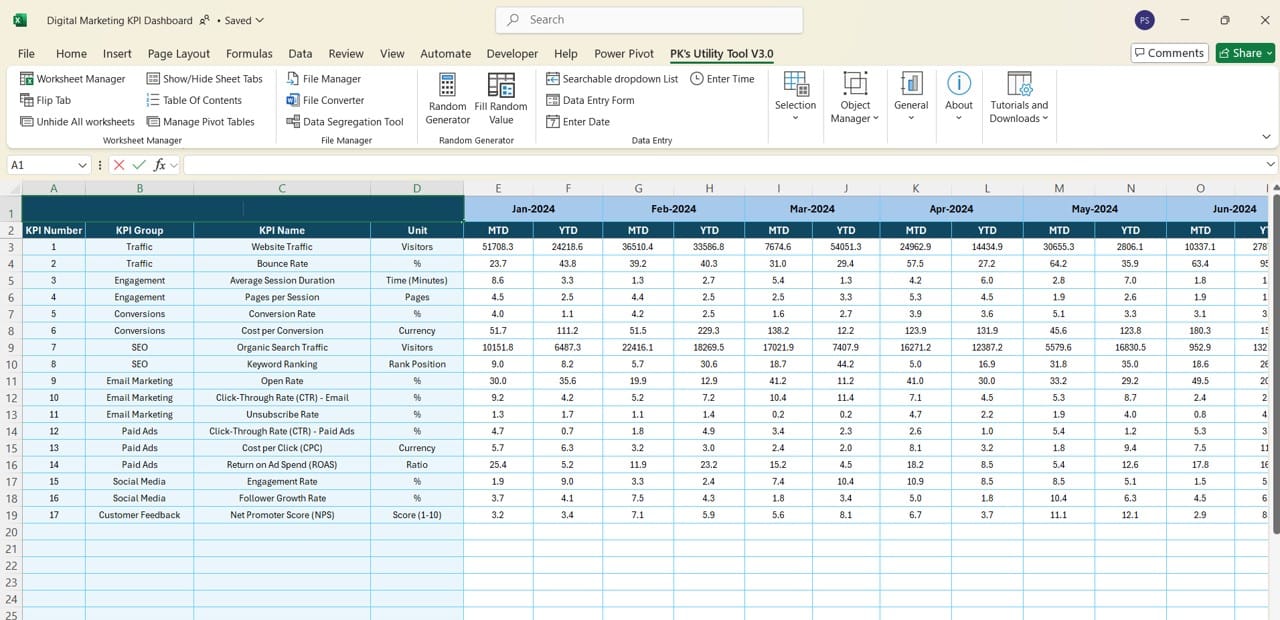
- This sheet allows you to input the actual performance data for each KPI.
- Enter monthly data for both MTD and YTD performance.
- The month displayed is controlled through the input in cell E1—just enter the first month of your fiscal year, and the dashboard will adjust automatically.
Target Sheet Tab
Target Sheet Tab
Click to buy Digital Marketing KPI Dashboard in Excel
- The Target sheet tab stores the performance targets for all KPIs. You need to enter both MTD and YTD targets for each KPI. Regular updates here ensure your dashboard reflects the latest objectives for each campaign.
Previous Year Number Sheet Tab
Previous Year Number Sheet Tab
Click to buy Digital Marketing KPI Dashboard in Excel
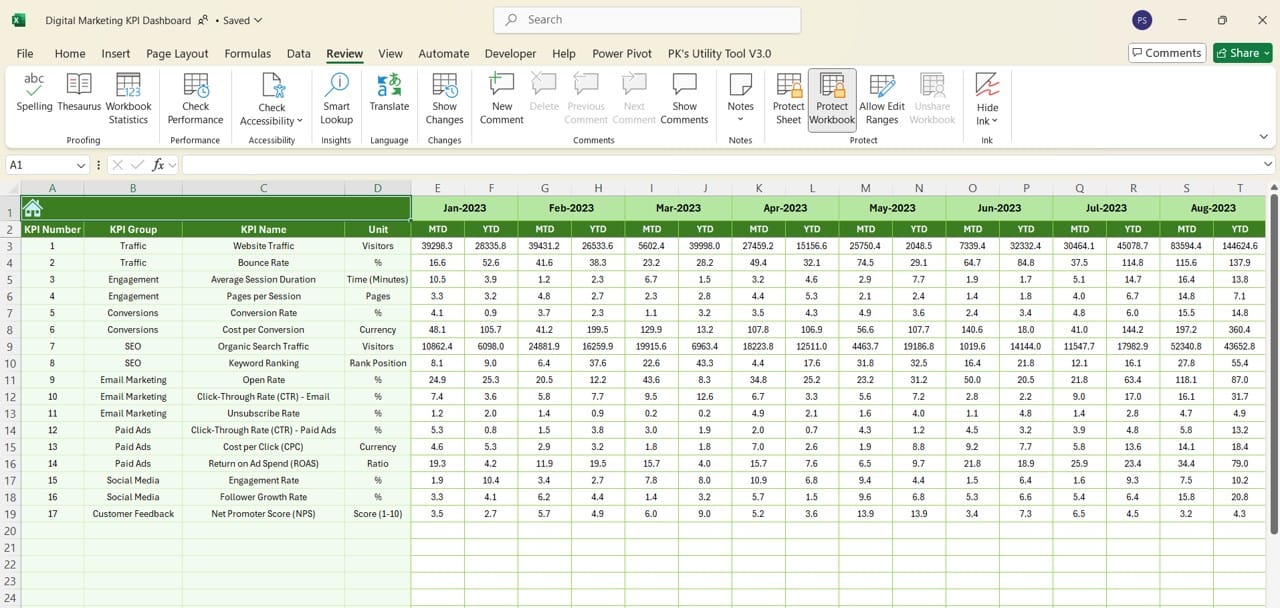
- To provide accurate comparisons, you must enter last year’s performance data for each KPI in this sheet. This helps you track year-over-year growth and identify long-term trends.
KPI Definition Sheet Tab
KPI Definition Sheet
Click to buy Digital Marketing KPI Dashboard in Excel
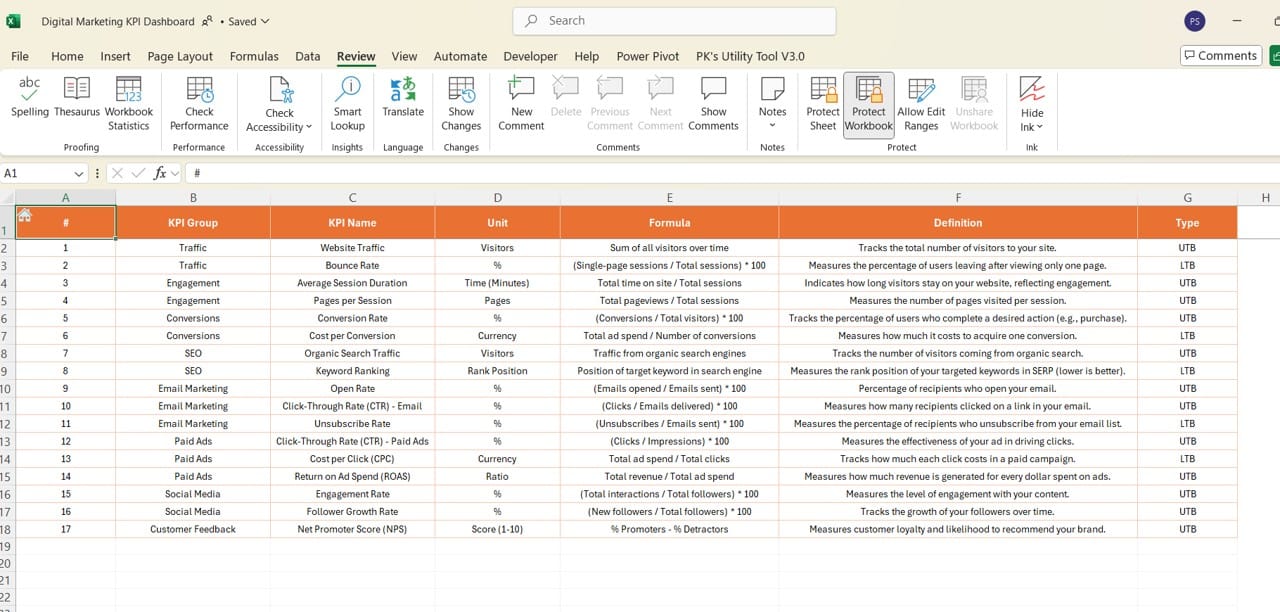
- This sheet contains the names, formulas, units, and definitions for each KPI. It serves as a reference guide to ensure everyone understands the metrics being tracked and reported.
Advantages of a Digital Marketing KPI Dashboard in Excel
- Comprehensive Performance Tracking: The dashboard centralizes all essential KPIs, making it easy to assess campaign effectiveness briefly.
- Customization Flexibility: Unlike online tools, an Excel dashboard can be tailored to your business needs, with custom formulas and charts.
- Data-Driven Decision Making: With real-time updates and historical comparisons, the dashboard helps you make informed marketing decisions.
- Time-Saving Reporting: Automated calculations and visual cues reduce the time spent on manual reporting tasks.
Click to buy Digital Marketing KPI Dashboard in Excel
Opportunities for Improvement in the Digital Marketing KPI Dashboard
- Real-Time Data Integration: Integrating the dashboard with Google Analytics or other platforms could enhance real-time tracking capabilities.
- Mobile-Friendly Version: Creating a mobile-optimized version of the dashboard would make it easier for marketers to access on the go.
- Automated Data Input: Using Power Query or VBA could automate data entry, minimizing errors and manual effort.
Click to buy Digital Marketing KPI Dashboard in Excel
Best Practices for Creating and Using a KPI Dashboard
- Select Relevant KPIs: Choose KPIs that align with your business goals. Too many metrics can overwhelm the user and dilute the focus.
- Use Clear Visuals: Leverage conditional formatting, charts, and visual indicators to highlight key insights.
- Keep it Updated: Ensure the dashboard is regularly updated with the latest data to maintain accuracy and relevance.
- Train Your Team: Provide training or documentation so everyone understands how to use the dashboard effectively.
- Monitor Trends: Use the trend charts to anticipate performance shifts and adapt your strategies accordingly.
Click to buy Digital Marketing KPI Dashboard in Excel
Conclusion
A Digital Marketing KPI Dashboard in Excel is an invaluable tool for marketers who want to stay on top of their campaigns. This template provides a seamless way to track performance, set targets, and make data-driven decisions. Whether you’re managing social media campaigns or PPC ads, having all your KPIs in one place ensures your team stays aligned and focused on achieving business goals.
Click to buy Digital Marketing KPI Dashboard in Excel
Frequently Asked Questions (FAQs)
Q. What is a Digital Marketing KPI Dashboard in Excel?
A Digital Marketing KPI Dashboard in Excel is a customizable template that tracks and reports key marketing metrics, such as social media engagement, website traffic, and conversion rates.
Q. Can I customize the KPIs in this dashboard?
Yes, the dashboard is fully customizable. You can add, remove, or modify KPIs according to your business needs.
Q. How often should I update the dashboard?
It is recommended to update the dashboard regularly, ideally on a monthly or weekly basis, to ensure accurate reporting.
Q. What are the benefits of tracking KPIs with Excel instead of online tools?
Excel offers greater customization options and data privacy compared to online tools. It is also more cost-effective for businesses that do not require real-time analytics.
Q. Can I automate data entry in this dashboard?
Yes, you can use Power Query or VBA macros to automate data input and reduce manual work.
This comprehensive guide should now give you all the necessary information to understand, implement, and optimize your Digital Marketing KPI Dashboard in Excel. By following the best practices and regularly updating the dashboard, you can ensure your marketing efforts stay on track and deliver the desired results.
Click to buy Digital Marketing KPI Dashboard in Excel
Visit our YouTube channel to learn step-by-step video tutorials
Click to buy Digital Marketing KPI Dashboard in Excel