In the digital era, managing and monitoring key performance indicators (KPIs) is crucial for IT departments to meet business goals effectively. This article explores the IT KPI Dashboard in Excel, a ready-to-use template designed for IT professionals. It offers a comprehensive solution to track and visualize KPIs with real-time insights into monthly, yearly, and historical performance data. This guide will walk you through the features, structure, and benefits of the dashboard while also highlighting the opportunities for improvement and best practices for using it IT KPI Dashboard in Excel.
Key Features of the IT KPI Dashboard
This Excel dashboard is built with seven worksheets, each playing a critical role in data management, visualization, and performance tracking. Below is a breakdown of these sheets:
Home Sheet
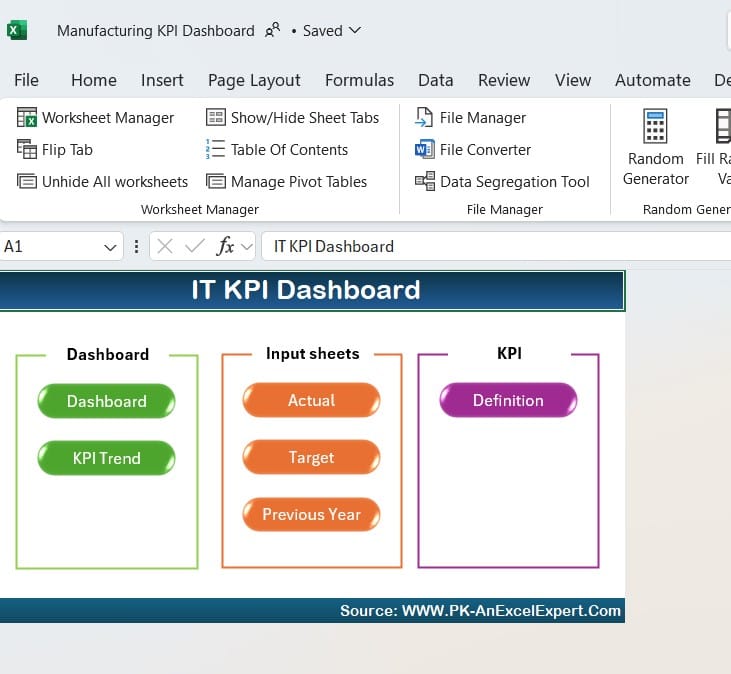
This sheet acts as an index with six interactive buttons that allow users to navigate to different sheets within the dashboard effortlessly. It improves usability and ensures quick access to relevant sections.
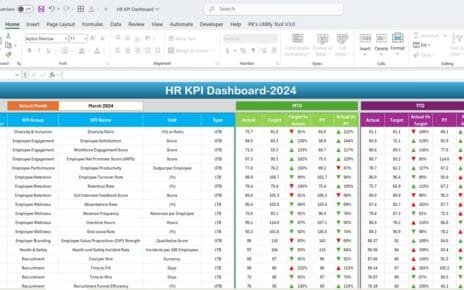
Dashboard Sheet Tab (Main Dashboard)
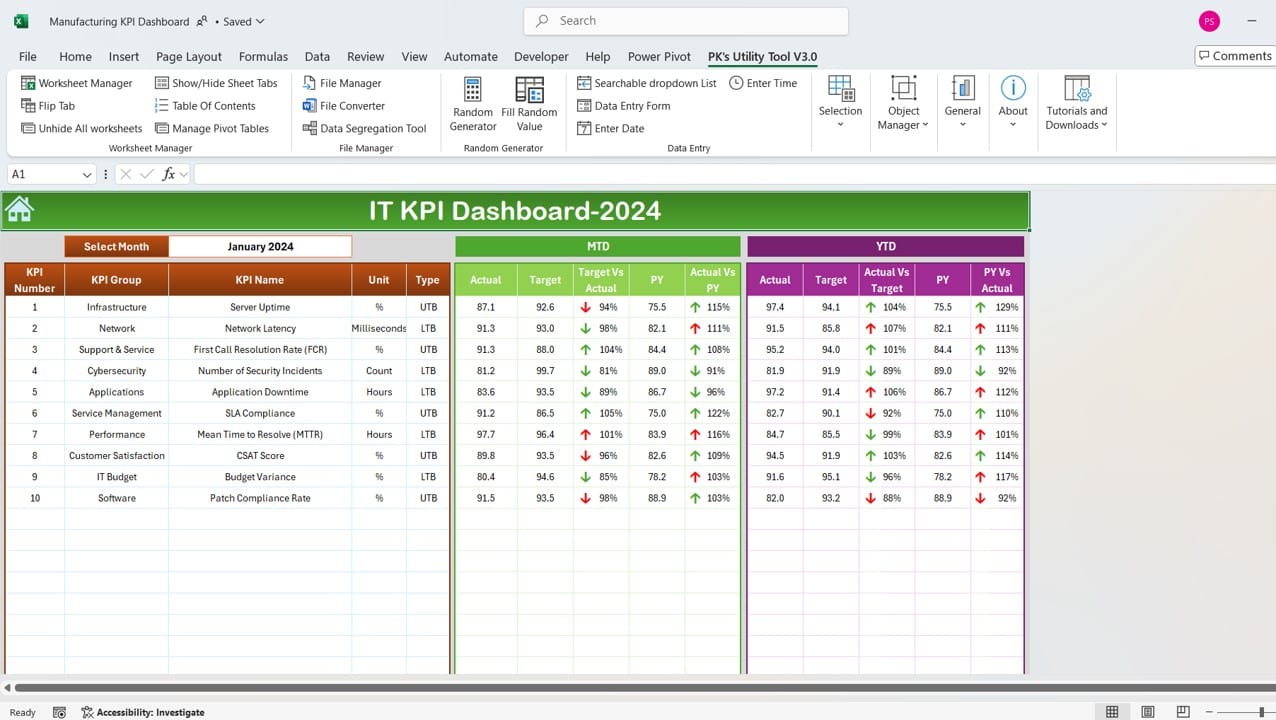
This is the heart of the IT KPI Dashboard in Excel, where you can monitor the real-time status of your KPIs. It offers:
- Month Selection (D3 Drop-Down): Allows users to choose a month, with all metrics updating dynamically based on the selection.
- MTD (Month-To-Date) View: Displays actual, target, and previous year (PY) performance.
- YTD (Year-To-Date) View: Offers aggregated data with a comparison of actual, target, and PY numbers.
- Conditional Formatting Arrows: Visual indicators (up/down arrows) show trends, making it easy to spot performance changes at a glance.
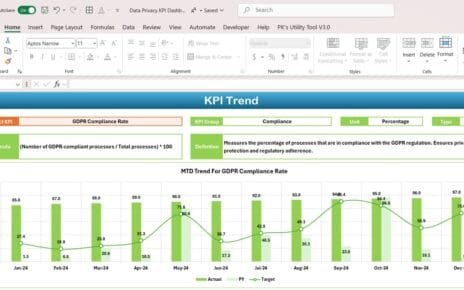
KPI Trend Sheet Tab
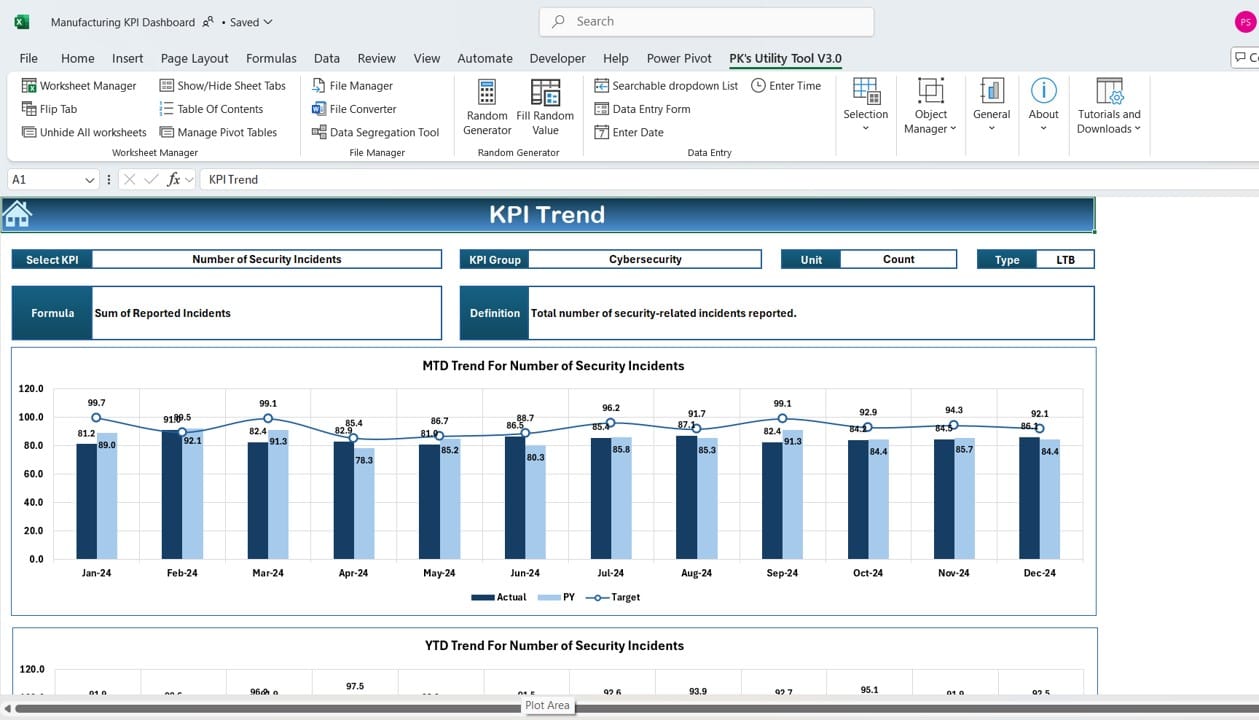
This sheet focuses on individual KPI trends. It provides:
- KPI Selection (Drop-Down in C3): Users can view trends for specific KPIs.
- KPI Attributes: Displays KPI Group, Unit, Type (e.g., “Lower the Better” or “Upper the Better”), and its formula and definition.
- Trend Charts: MTD and YTD trend charts help visualize performance trends for actual, target, and PY values over time.
Actual Numbers Input Sheet
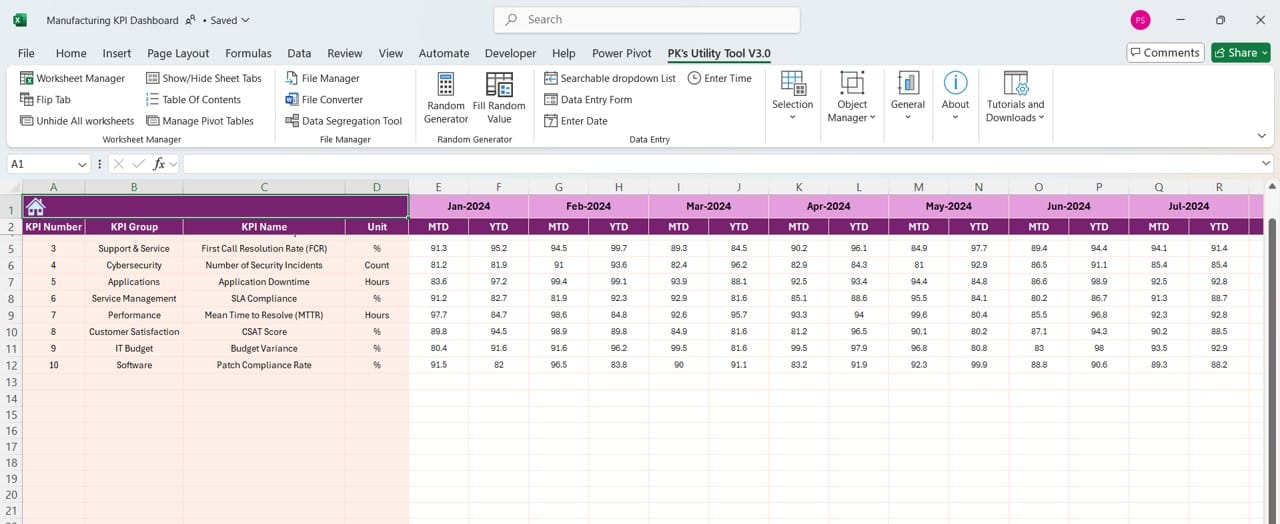
This sheet is where users enter actual performance data:
- Monthly Data: Input YTD and MTD numbers for each KPI.
- Month Selection (E1): Choose the starting month of the year to align the dashboard accordingly.
Target Sheet Tab
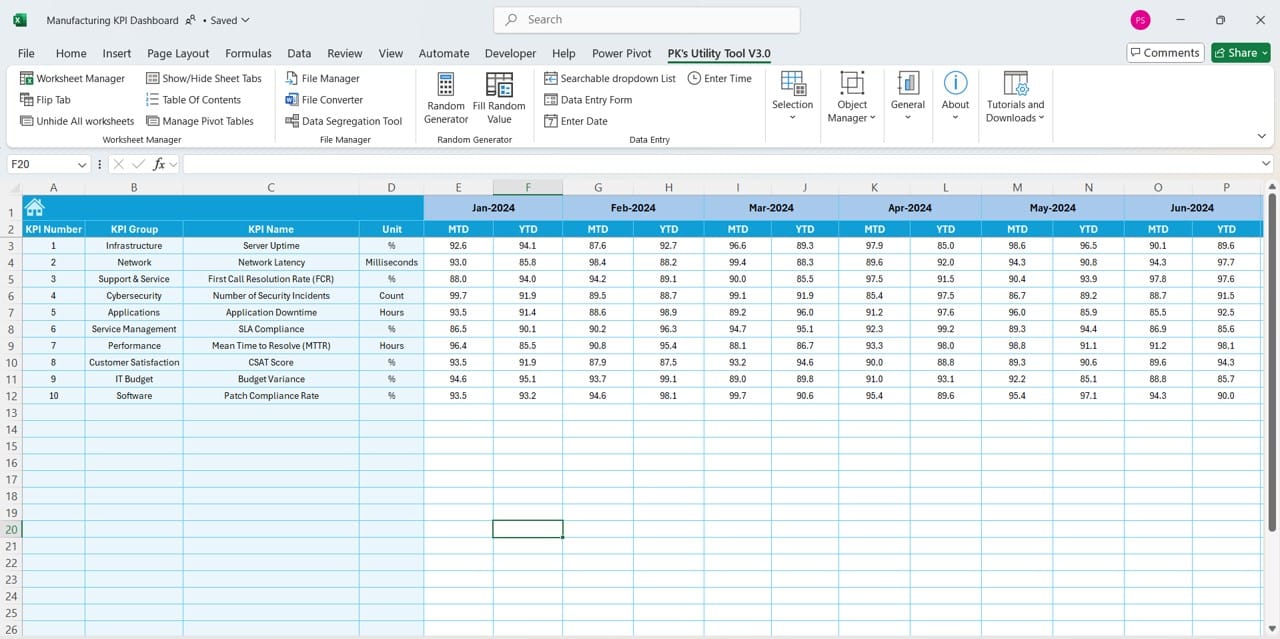
Target Sheet
This sheet allows users to input target numbers for each KPI on both a monthly and yearly basis. Clear entry points ensure that tracking stays consistent with the organization’s goals.
Previous Year Numbers Sheet Tab
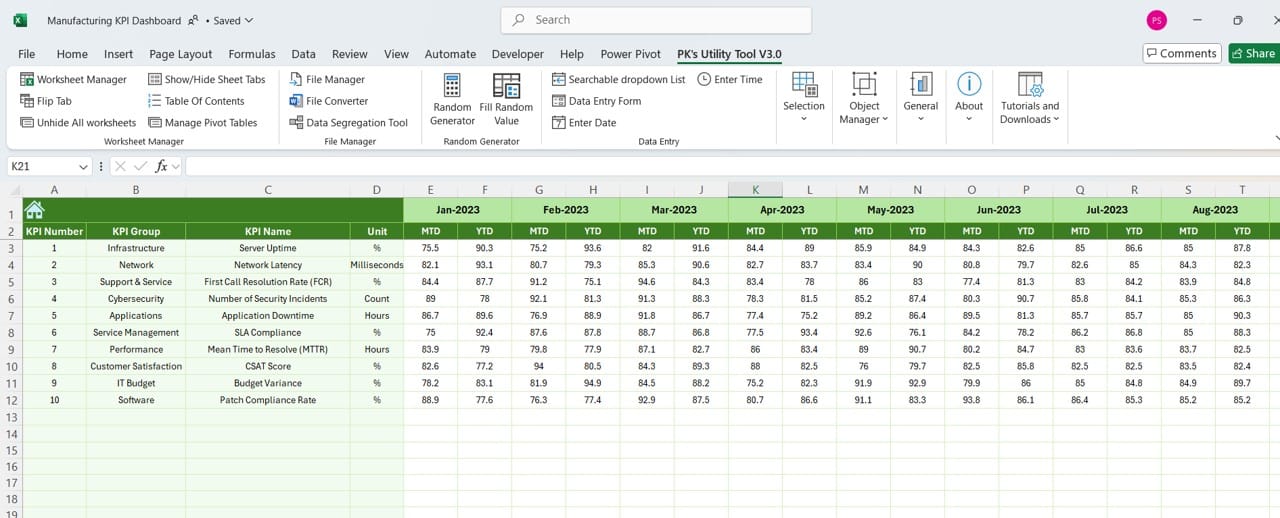
Previous Year Numbers Sheet
This sheet requires users to input previous year data in the same structure as the current year. It enables accurate comparisons for performance benchmarking.
KPI Definition Sheet Tab
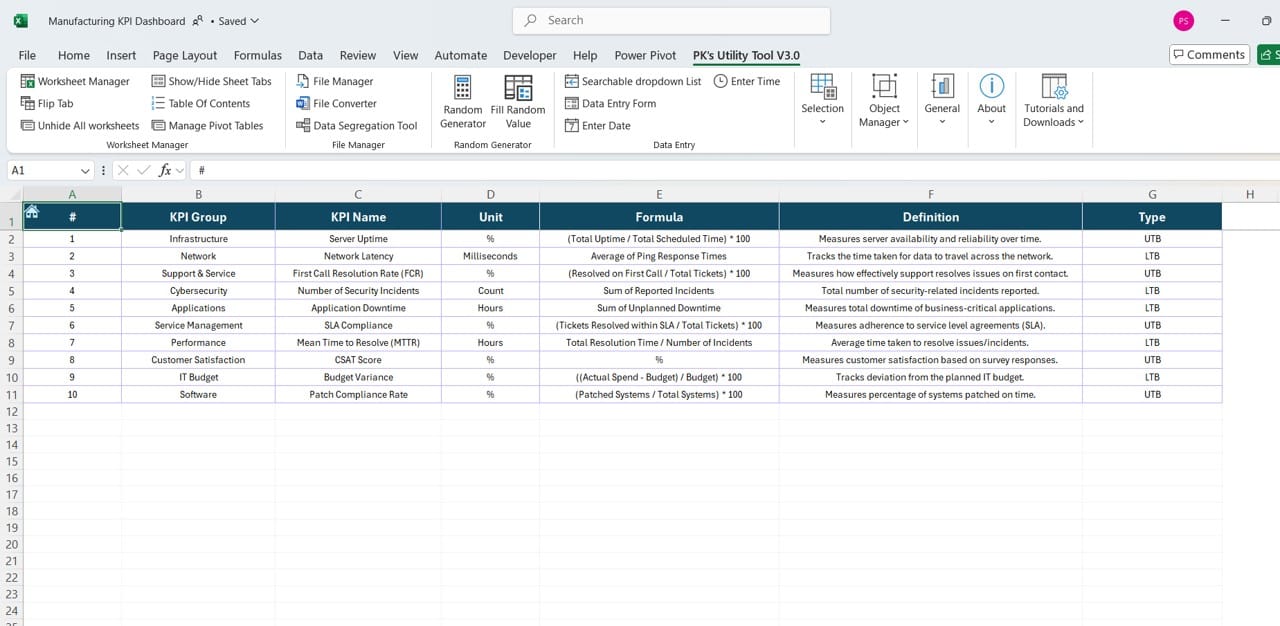
In this section, users can manage and update KPI definitions by entering the following:
- KPI Name and Group
- KPI Unit and Formula
- Detailed KPI Definition
Advantages of the IT KPI Dashboard in Excel
- User-Friendly Interface: The interactive buttons on the Home Sheet provide easy navigation across different sections, making it user-friendly even for non-technical users.
- Comprehensive Data Insights: The dashboard offers both MTD and YTD views, ensuring comprehensive insights into current and past performance trends.
- Customizable to Meet Business Needs: With the KPI definition sheet and trend options, organizations can customize the dashboard to align with their specific KPIs and goals.
- Real-Time Performance Monitoring: Users can switch between months instantly using the drop-down menus, giving real-time insights with updated charts and numbers.
Opportunity for Improvement in the IT KPI Dashboard
While the current dashboard offers several features, there are some areas for improvement:
- Automated Data Entry: Integrating an automated data import feature, such as a connection with Google Sheets or SQL databases, can minimize manual data entry errors.
- Mobile-Friendly Version: Creating a mobile-optimized version of the dashboard or integrating it with online platforms like Microsoft Power BI could improve accessibility for on-the-go users.
- Advanced Conditional Formatting: Adding more color-coded indicators for different performance levels (e.g., green for above target, red for below) can enhance visualization.
- Alerts and Notifications: Incorporating automated alerts for missed targets or KPI anomalies would help organizations address issues proactively.
Best Practices for Using the IT KPI Dashboard
- Ensure Data Accuracy: It is essential to update the actual, target, and PY numbers consistently to maintain the reliability of the dashboard.
- Leverage Trend Analysis: Use the trend charts to forecast future performance and identify areas needing improvement. This proactive approach can help set realistic targets.
- Keep the Dashboard Updated: Revisit the KPI definitions periodically to ensure that the dashboard aligns with evolving business goals.
- Train Your Team: Provide training to relevant stakeholders on how to use the dashboard effectively to ensure everyone benefits from the available insights.
- Automate Data Refresh: If possible, automate the data refresh process to eliminate the need for manual inputs and ensure the most current data is displayed.
Conclusion
The IT KPI Dashboard in Excel is a powerful tool for IT professionals to monitor, track, and analyses key performance indicators efficiently. It provides valuable insights into both monthly and yearly trends, helping organizations stay on top of their goals. The dashboard’s structure, with its seven sheets, ensures every critical aspect of KPI management is covered. Moreover, with a few improvements such as automation, advanced formatting, and mobile compatibility, the dashboard can become even more powerful.
Frequently Asked Questions (FAQs)
Q. What is an IT KPI Dashboard?
An IT KPI Dashboard is a performance-tracking tool that displays key metrics related to IT operations and projects. It helps monitor progress, identify trends, and align IT efforts with business objectives.
Q. How do I use the month selection feature on the dashboard?
You can select a month from the drop-down list in cell D3 of the Dashboard sheet. The numbers and charts will automatically update based on your selection.
Q. Can I customize the KPIs in this dashboard?
Yes, you can customize the KPIs by updating the KPI definitions in the KPI Definition sheet. You can add new KPIs or modify existing ones to match your organization’s needs.
Q. How do I enter actual and target data?
You can enter actual data in the “Actual Numbers Input Sheet” and target data in the “Target Sheet.” Make sure to align the months correctly by selecting the first month of the year in cell E1.
Q. What should I do if the data does not refresh correctly?
Ensure that all sheets are correctly linked, and formulas are intact. You can also refresh the Excel file manually or automate the process for future updates.
Q. How do the conditional formatting arrows work?
The up and down arrows in the dashboard indicate performance trends. If the current value exceeds the target or PY value, the arrow points upward, showing positive performance. Otherwise, it points downward.
This article offers everything you need to know about the IT KPI Dashboard in Excel, from its structure to its best practices. With this guide, you are now well-prepared to utilize the dashboard effectively and ensure your IT KPI Dashboard in Excel operations are aligned with business goals.
Visit our YouTube channel to learn step-by-step video tutorials