Managing construction projects can be a huge task, right? From juggling deadlines, tracking progress, and staying on top of the budget, it can feel overwhelming at times. Luckily, there’s a tool that can make life a lot easier for you — the Construction KPI Dashboard in Excel.
If you’re looking for a way to stay organized, track key performance indicators (KPIs), and improve your decision-making, this dashboard might be just what you need. In this guide, we’ll walk through what a construction KPI dashboard is, its key features, how to use it, and why it can seriously boost your project management game. Plus, we’ll talk about some best practices, improvement tips, and answer a few frequently asked questions at the end. Let’s dive in!
What’s a Construction KPI Dashboard Anyway?
Simply put, a Construction KPI Dashboard is a tool built in Excel that helps you track all the important metrics (KPIs) for your construction projects. Whether you need to monitor your project completion rates, cost variance, or safety incidents, the dashboard organizes everything into one simple view.
Since it’s in Excel, it’s super flexible, interactive, and customizable to meet the specific needs of your projects. So, you can tweak it however you like!
Why Should You Track KPIs in Construction?
Managing a construction project is no small feat. You’ve got multiple people working on different tasks, tight deadlines to hit, and budgets to stick to. Keeping track of all that is critical to the success of any project. Here’s how tracking KPIs can help:
- Monitor progress: See where your project stands at any moment.
- Set benchmarks: Compare actual results against your goals to stay on track.
- Improve efficiency: Real-time insights help you find areas for improvement.
- Enhance decision-making: The right data allows you to make smarter, faster decisions.
Key Features of a Construction KPI Dashboard in Excel
The Construction KPI Dashboard we’ve built is designed to be simple and efficient. It’s packed with seven different worksheets, covering everything from data entry to KPI analysis. Let’s break them down:
Click to buy Construction KPI Dashboard in Excel
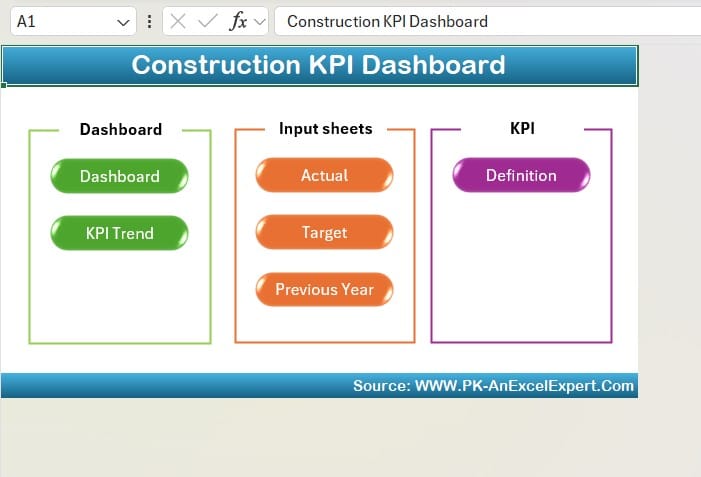
Home Sheet – Your Starting Point
The Home Sheet is where you’ll begin. Think of it as your control center. This page has six buttons that make it super easy to jump between different sections of the dashboard.
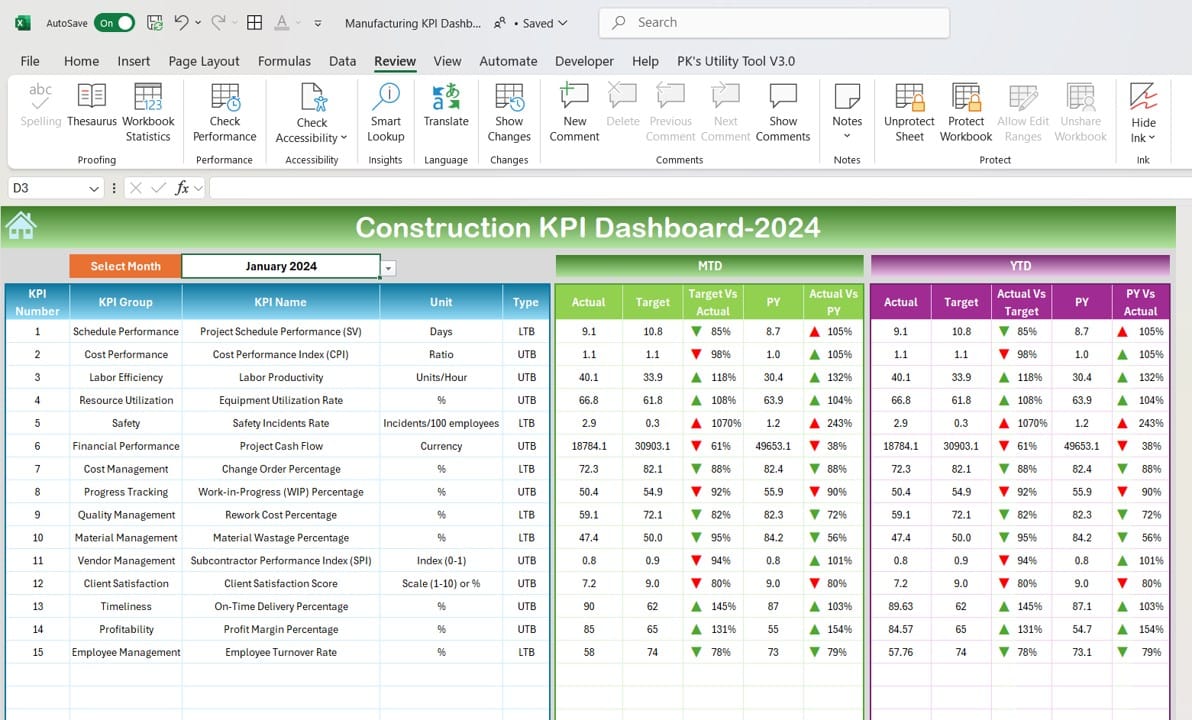
Dashboard Sheet – The Heart of the Tool
The Dashboard Sheet is where all the action happens. This is where you’ll view all your key KPIs in one place. Here’s what you’ll find:
A month selector in cell D3, where you can pick a specific month and see the numbers update instantly.
MTD (Month to Date) and YTD (Year to Date) metrics, showing actual performance, targets, and data from last year.
Target vs. Actual and Previous Year (PY) vs. Actual comparisons, with handy up-and-down arrows thanks to conditional formatting. This makes spotting trends quick and easy.
Click to buy Construction KPI Dashboard in Excel
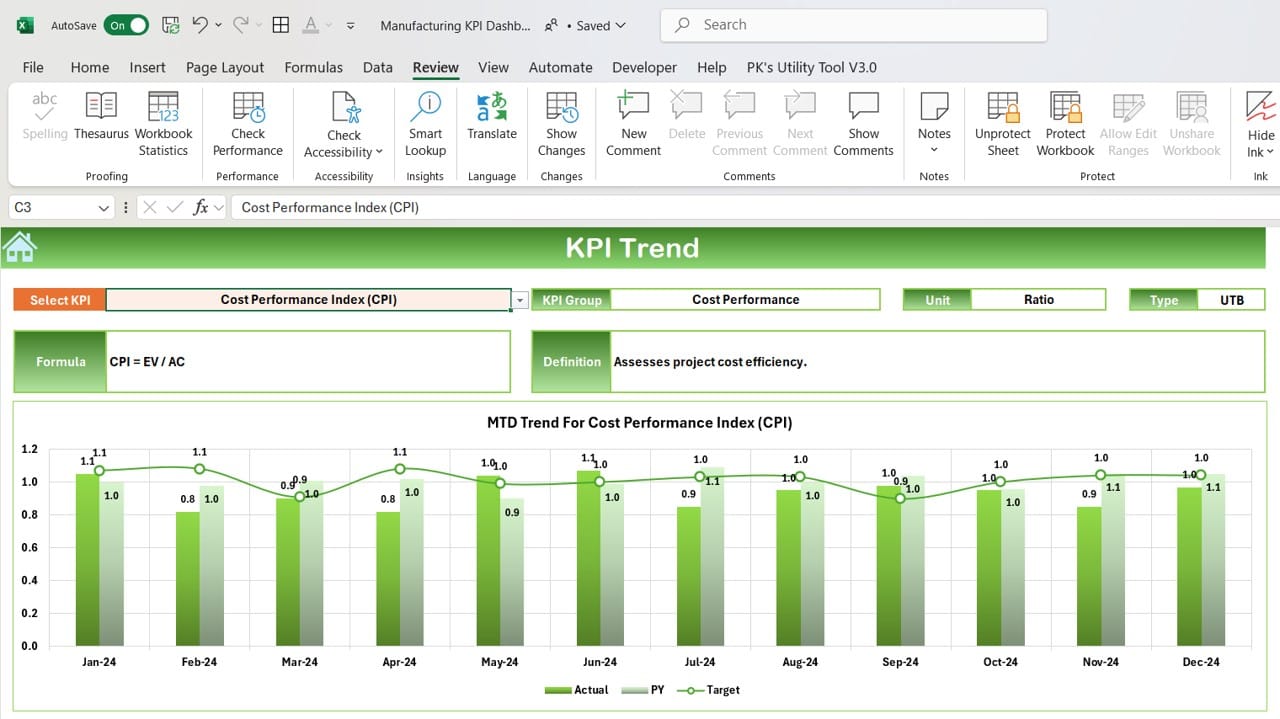
KPI Trend Sheet – Get Into the Details
Want to dig a little deeper into your KPIs? The KPI Trend Sheet lets you do just that. Using a dropdown in range C3, you can choose any KPI and view more detailed info like:
The KPI group and unit of measurement.
Whether it’s better for the KPI to be higher or lower.
The formula and a detailed definition of the KPI.
This sheet helps you understand how each KPI works and why it’s important.
Click to buy Construction KPI Dashboard in Excel
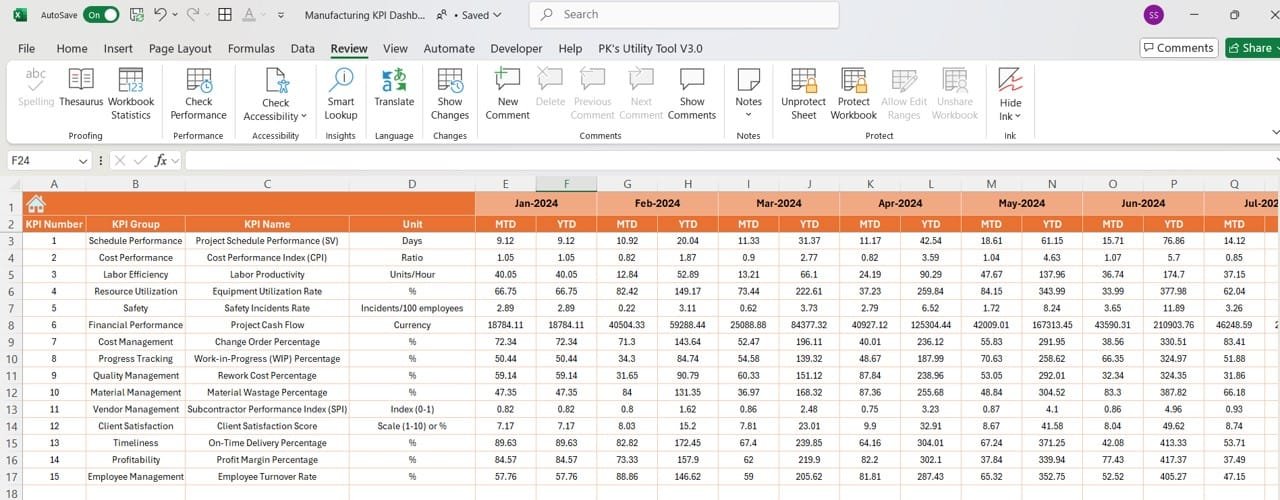
Actual Numbers Sheet – Keep Track of What’s Happening
In the Actual Numbers Sheet, you’ll enter the actual numbers for each month. Here’s what you need to know:
Input the MTD and YTD figures for the month you’re tracking, and the dashboard will update automatically.
To change the month, just update range E1. For example, enter “January” if you want to input data for that month.
Click to buy Construction KPI Dashboard in Excel
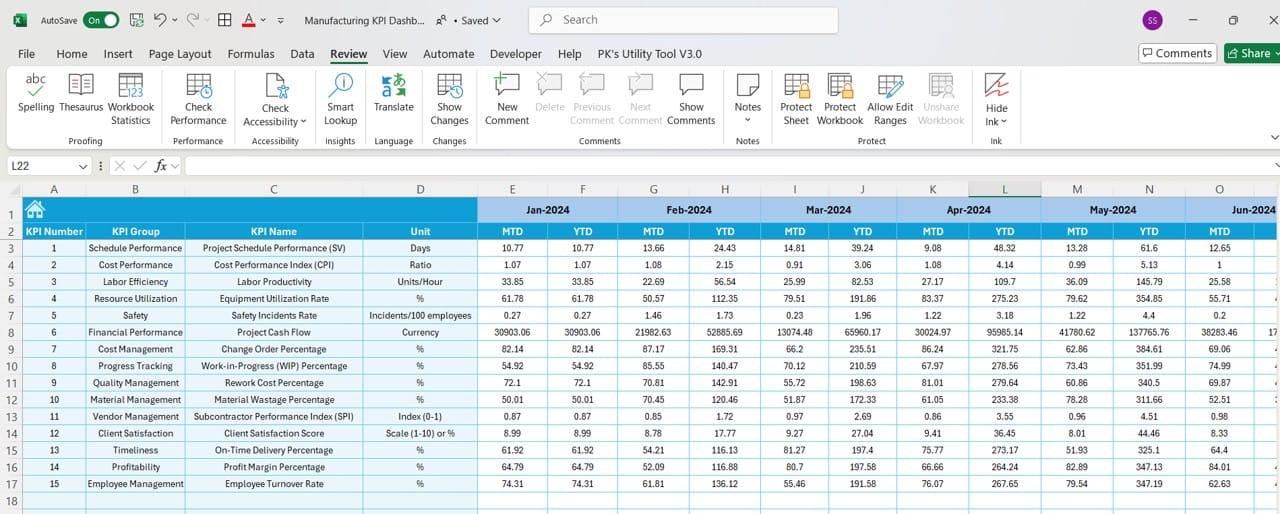
Target Sheet – Set Your Goals
The Target Sheet is where you’ll set target numbers for each KPI. Whether it’s for MTD or YTD, this is where you’ll see how close you are to hitting your goals.
Click to buy Construction KPI Dashboard in Excel
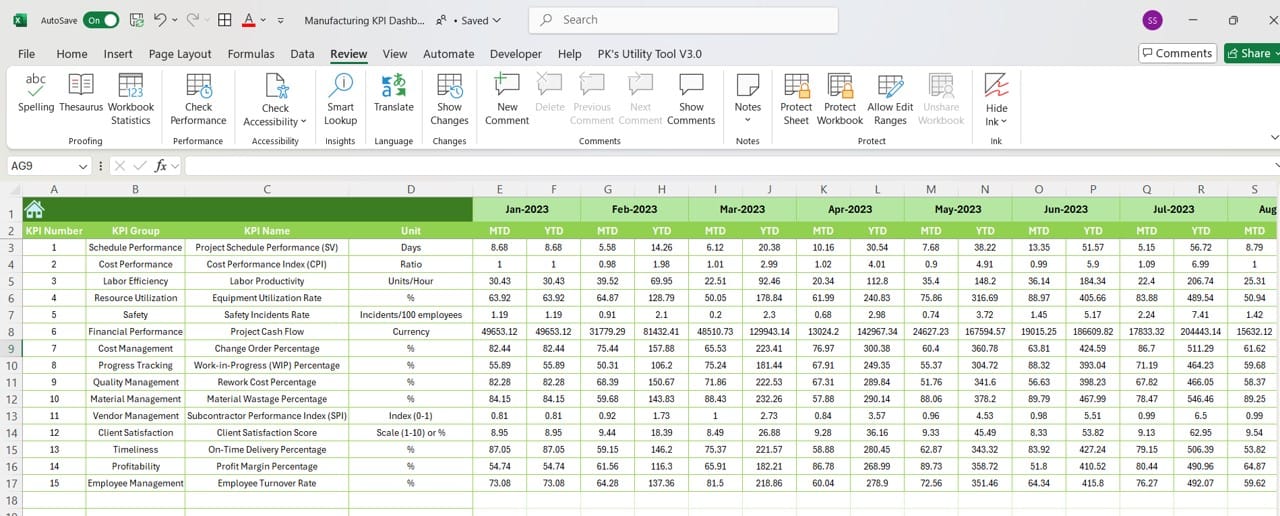
Previous Year Numbers Sheet – Look Back and Compare
The Previous Year Numbers Sheet works just like the Target Sheet, but this time, you’re entering numbers from the previous year. This way, you can easily compare how things have improved or changed over time.
Click to buy Construction KPI Dashboard in Excel
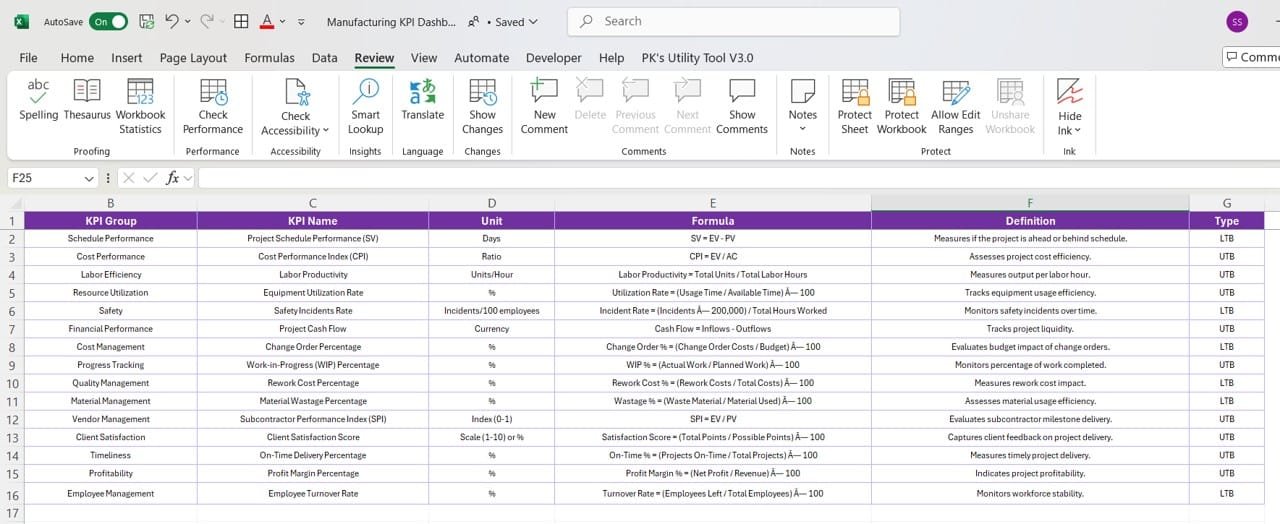
KPI Definition Sheet – Stay Organized
Finally, the KPI Definition Sheet keeps everything organized. Here, you can document the KPI Name, Group, Unit, Formula, and Definition. It’s important to have this sheet because it ensures everyone on your team understands what each KPI means.
Why a Construction KPI Dashboard in Excel is a Game-Changer
- Real-Time Monitoring: The dashboard provides real-time insights into your project’s progress. Instead of waiting for monthly or quarterly reports, you can see what’s happening right now and address any issues before they become bigger problems.
- Easy Customization: One of the best things about this dashboard is how easily customizable it is. You can tweak it to include the KPIs that matter most to your specific project, so you’re not wasting time tracking irrelevant metrics.
- Cost-Effective Solution: Since the dashboard is built in Excel, it’s a cost-effective solution. Most companies already have Excel, so there’s no need to invest in expensive project management software. You get the same results without the extra cost.
- Better Decision-Making: When you have all the important data laid out in front of you, it becomes much easier to make data-driven decisions. You can quickly analyze what’s working, what’s not, and where you need to focus your attention.
- Simple Sharing and Collaboration: Need to share your dashboard with the team? No problem! Excel files are easy to share, whether it’s through email or a shared drive, so collaboration is a breeze.
Click to buy Construction KPI Dashboard in Excel
Opportunities to Improve Your Construction KPI Dashboard
Even though the dashboard is great, there are always ways to make it better. Here are some improvement ideas:
- Automating Data Entry: Right now, you have to manually enter your data, which can lead to human error. By automating data entry and linking the dashboard to a project management system, you can save time and improve accuracy.
- Add More Visuals: While the dashboard already includes basic visuals with conditional formatting, adding more charts and graphs could make the data even easier to understand and more engaging.
- Integrate with Real-Time Data: By connecting the dashboard with real-time project management software, you can have live updates without needing to manually enter data. This would make the dashboard even more powerful, providing real-time insights on the go.
Best Practices for Using Your Construction KPI Dashboard
To get the most out of your dashboard, follow these best practices:
- Set Clear KPIs from the Start: Before using your dashboard, make sure your KPIs are well-defined. The clearer your metrics, the easier it will be to track and measure your progress.
- Keep the Data Updated: Don’t forget to update your actual numbers, targets, and previous year data regularly. This will ensure that the dashboard accurately reflects the current status of your project.
- Simplify the Interface: Make sure the dashboard is easy to use for everyone on your team, not just Excel experts. Use color coding, icons, and clear labels to make it intuitive.
- Focus on Key Metrics: It’s easy to get carried away and try to track too many KPIs, but it’s better to focus on the most important metrics for your project. This will help you make better decisions faster.
Conclusion
A Construction KPI Dashboard in Excel is a must-have tool for project managers who want to stay on top of their game. With its real-time monitoring, easy customization, and cost-effective nature, it’s perfect for keeping track of your project’s progress, setting benchmarks, and making smart, data-driven decisions.
Whether you’re managing budgets, tracking on-time delivery, or monitoring safety metrics, this dashboard will give you the insights you need to keep your construction project running smoothly.
Frequently Asked Questions (FAQs)
Q. What is a Construction KPI Dashboard?
A . Construction KPI Dashboard is an Excel-based tool that helps you track and monitor key performance indicators (KPIs) for your construction projects. It allows project managers to stay updated on progress, make informed decisions, and manage different aspects of the project efficiently.
Q. Can I customize the KPIs in the dashboard?
Yes, the dashboard is highly customizable. You can add or remove KPIs based on your project’s specific needs. The KPI Definition Sheet helps you stay organized as you manage these changes.
Q. How do I update the dashboard for a new month?
It’s easy! Just go to the Actual Numbers Sheet and change the month in range E1. Once you input the new month’s data, the dashboard will update automatically.
Q. What kind of KPIs can I track with this dashboard?
The dashboard can track a variety of KPIs, including project completion rates, budget variance, and cost performance index. You can also set whether higher or lower values are better for each KPI.
Visit our YouTube channel to learn step-by-step video tutorials
Click to buy Construction KPI Dashboard in Excel