The Quality KPI Dashboard in Excel is a powerful, ready-to-use tool designed for tracking and managing key quality metrics within your business. This customizable template provides a clear and dynamic view of both month-to-date (MTD) and year-to-date (YTD) KPIs, allowing for better decision-making and continuous quality improvement KPI Dashboard in Excel.
Key Features:
Home Sheet:
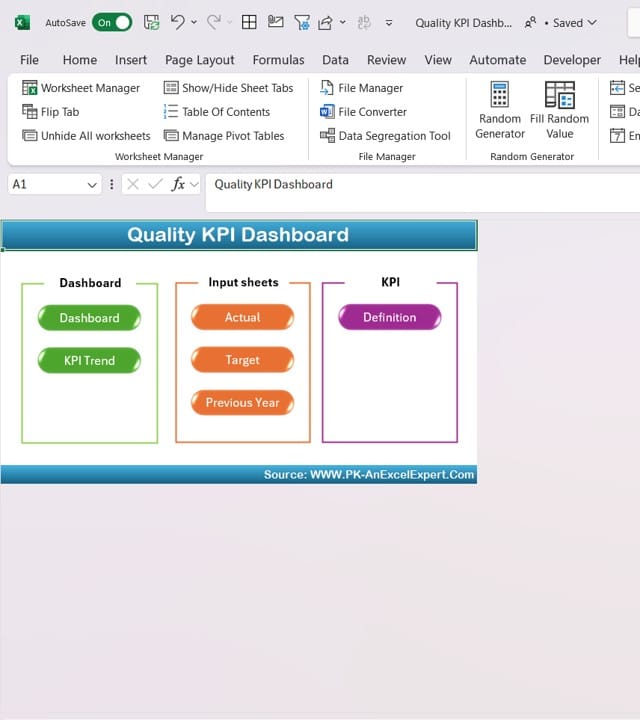
Easy-to-navigate index with buttons for quick access to all major sections of the dashboard.
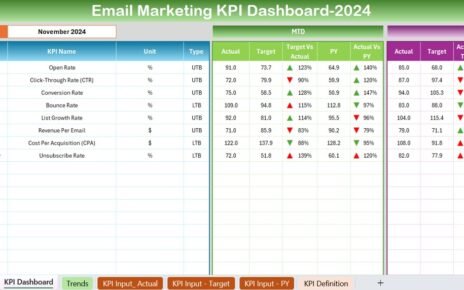
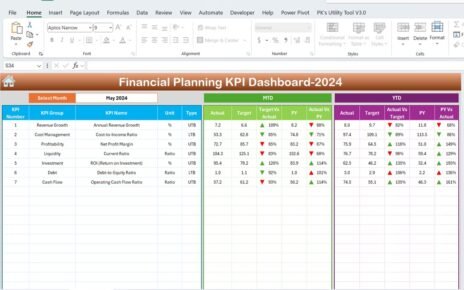
Dashboard Sheet:
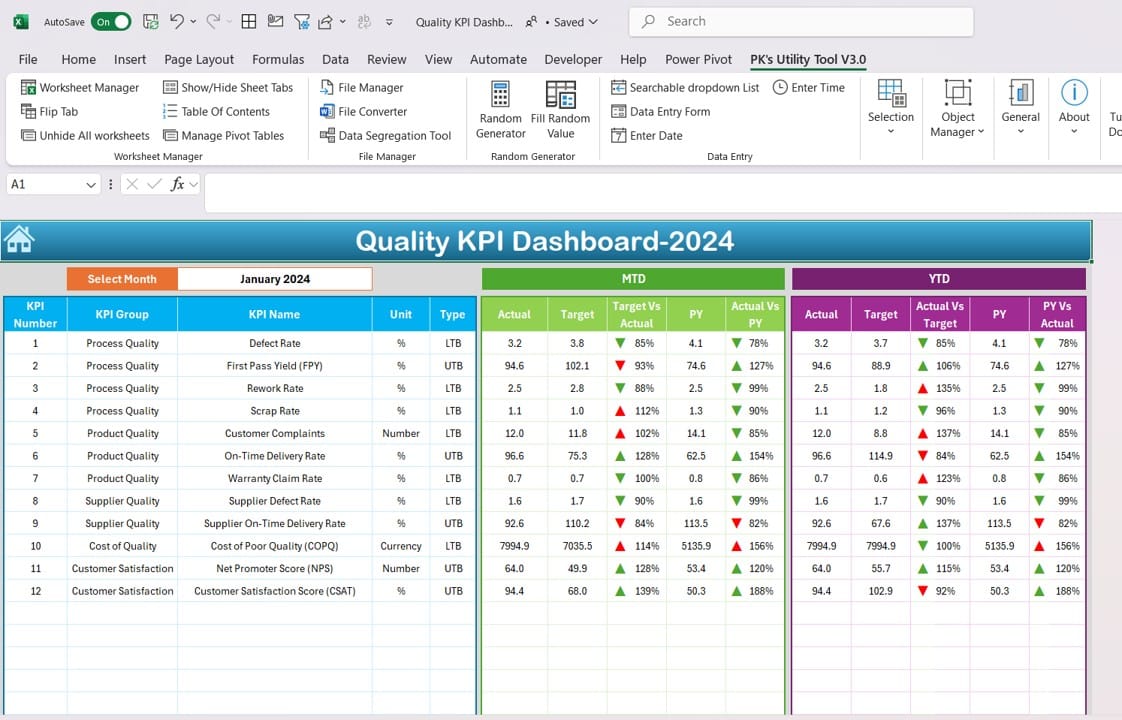
Displays MTD and YTD performance with conditional formatting to highlight targets vs. actuals, including previous year comparisons.
KPI Trend Sheet:
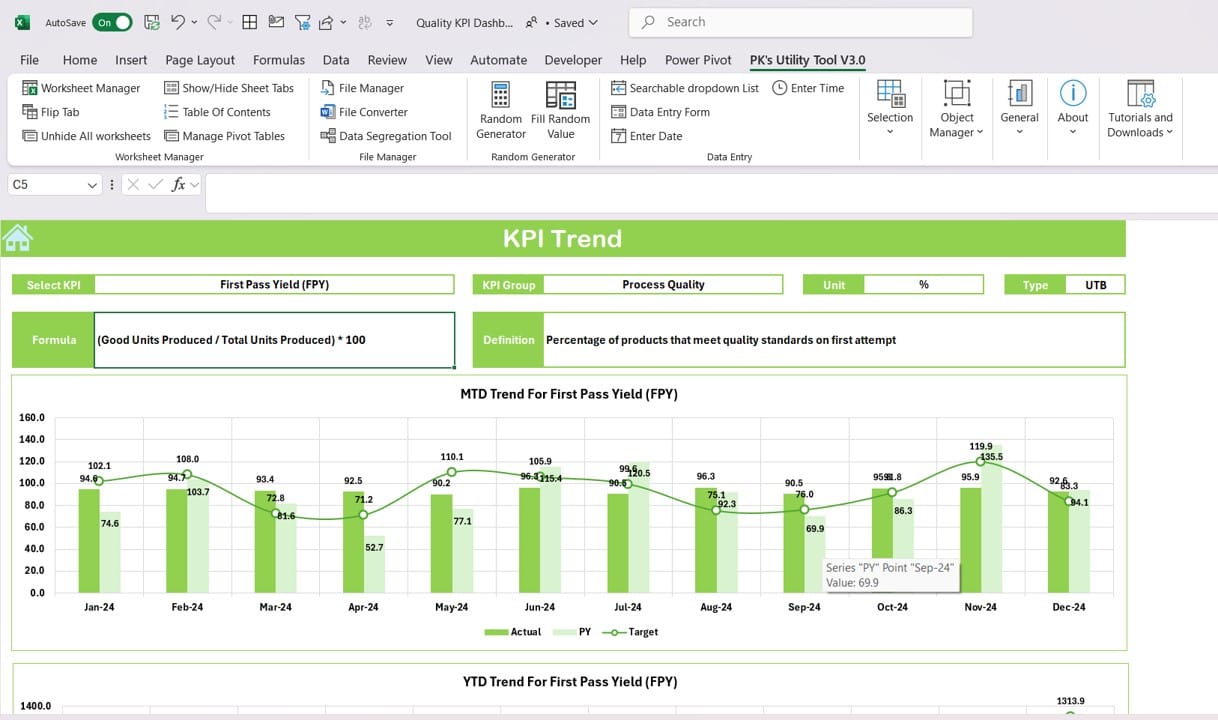
Allows selection of specific KPIs, showing detailed trends with charts and key KPI attributes such as unit, type, and definition.
Data Input Sheets:
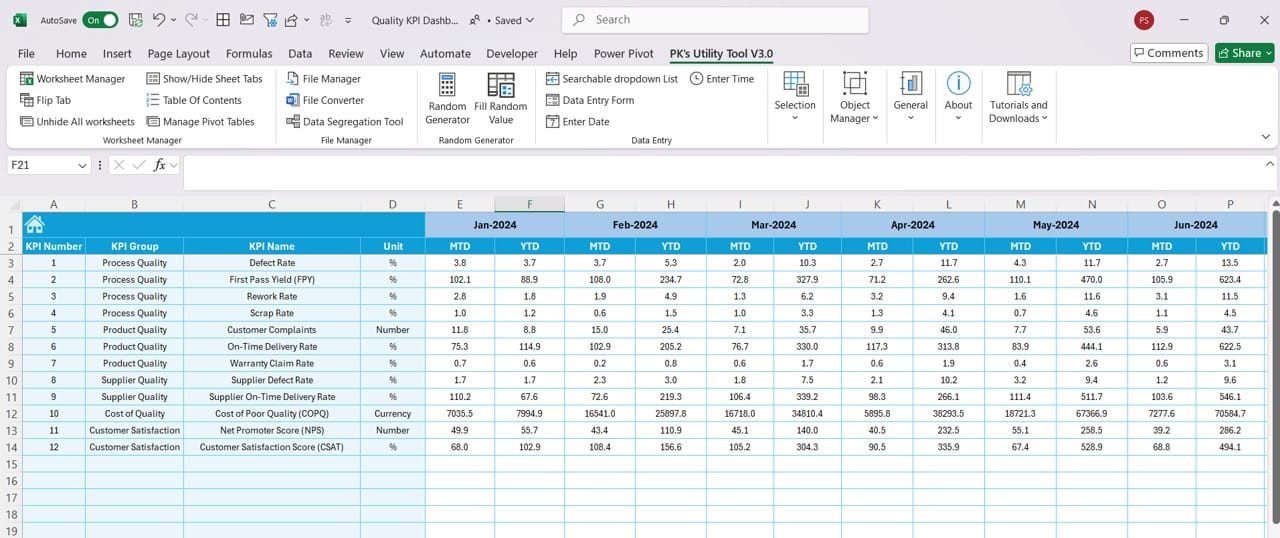
Data Input Sheets Simplified entry of actual, target, and previous year data for efficient tracking of performance.
KPI Definition Sheet:
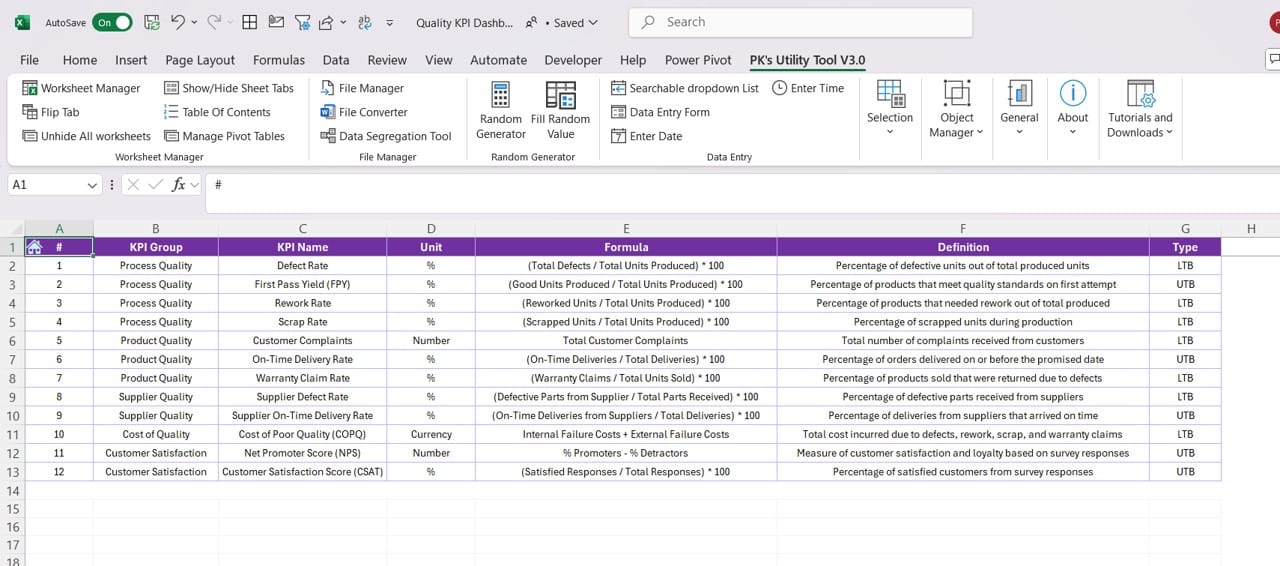
Comprehensive listing of KPIs with formula, unit, and description for consistent tracking and clarity across the team.
Read the detailed blog post