The Non-Profit KPI Dashboard in Excel is a powerful, ready-to-use tool designed to help non-profit organizations track and monitor their key performance indicators (KPIs) efficiently. This Excel dashboard offers a user-friendly interface that allows non-profits to measure critical metrics like donor retention, program impact, and financial performance, ensuring they can make data-driven decisions to further their mission.
Key Features:
Home Sheet:
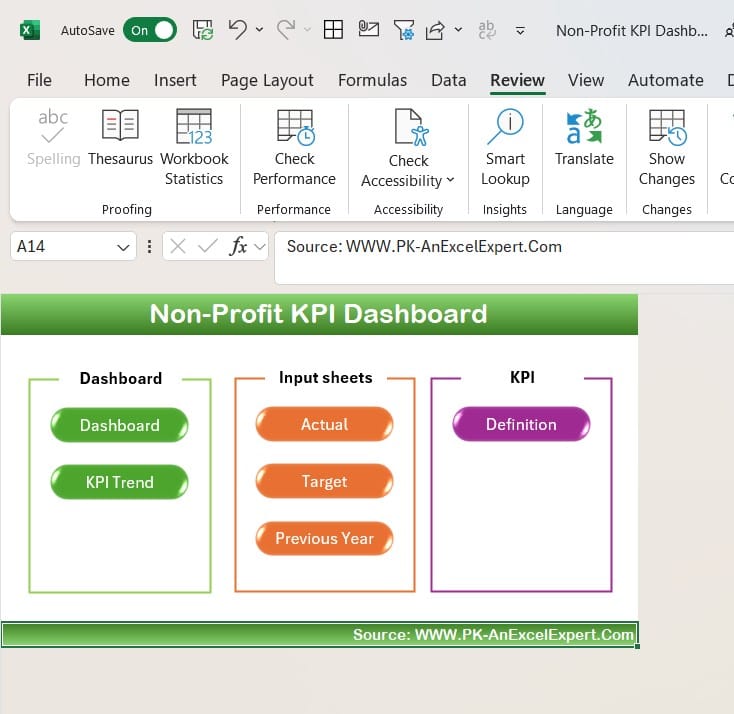
Easy navigation with buttons to quickly access different sections of the dashboard.
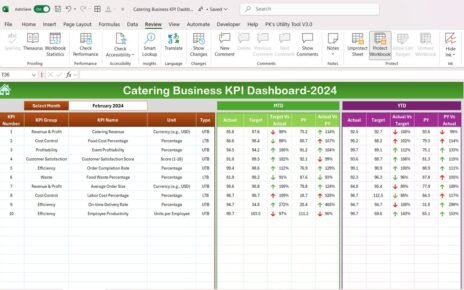
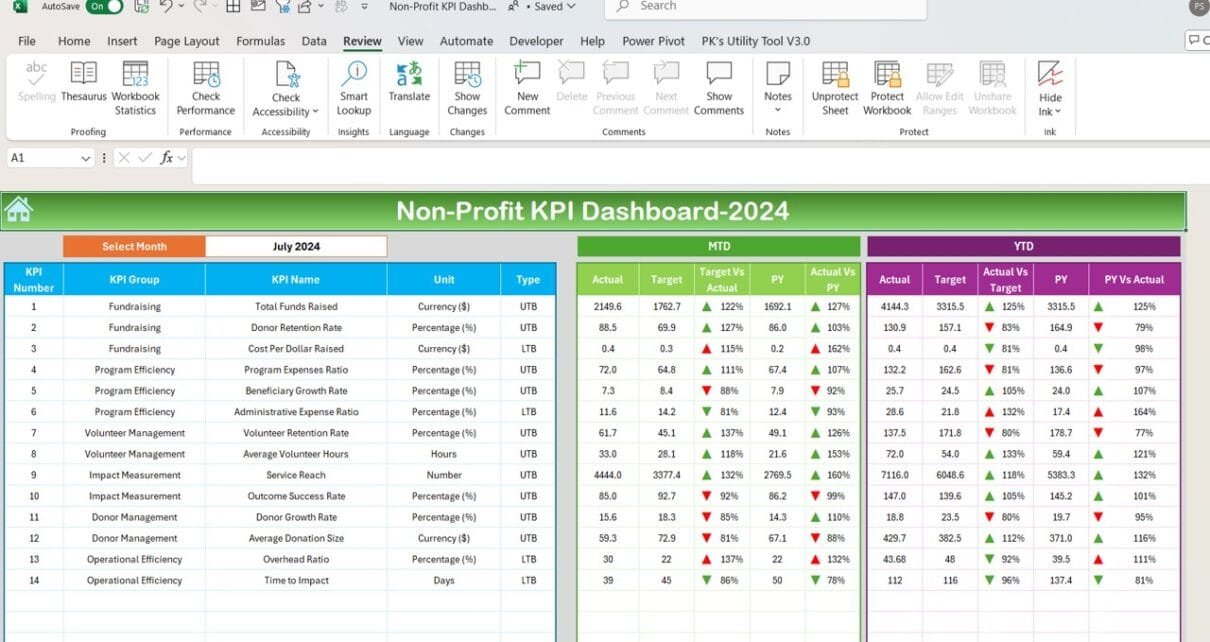
Dashboard Tab:

View real-time MTD and YTD metrics with visual indicators for performance compared to targets and previous year values.
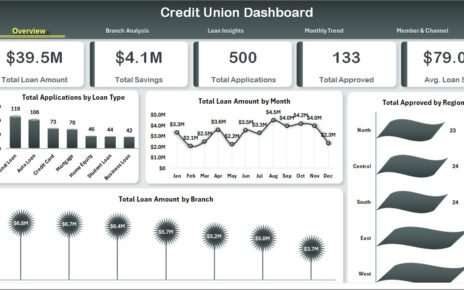
KPI Trend Tab:
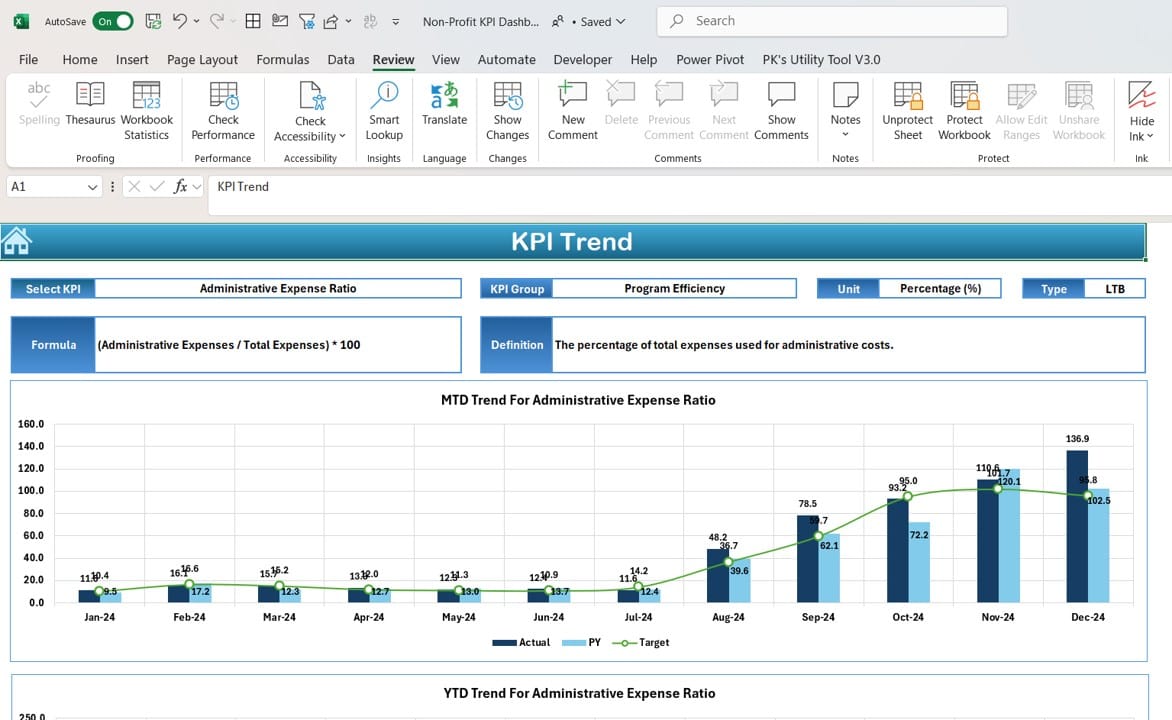
Analyze specific KPI trends with detailed charts and performance metrics.
Data Input Sheets:
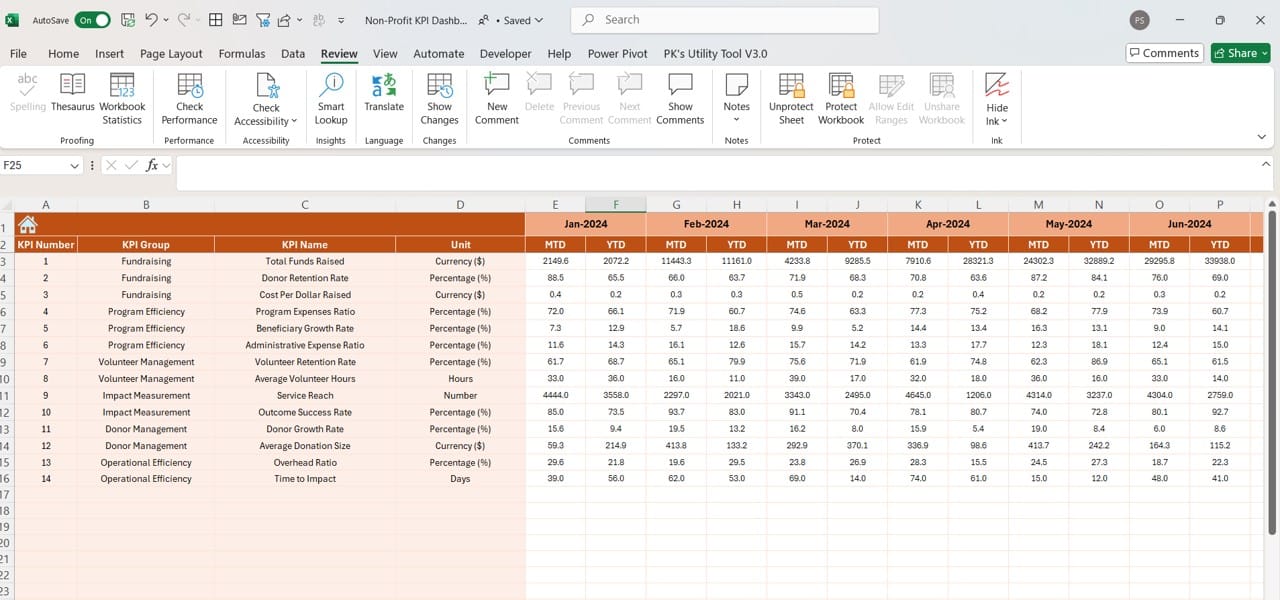
Seamlessly enter actual, target, and previous year numbers for each KPI, ensuring accurate tracking.
KPI Definitions:
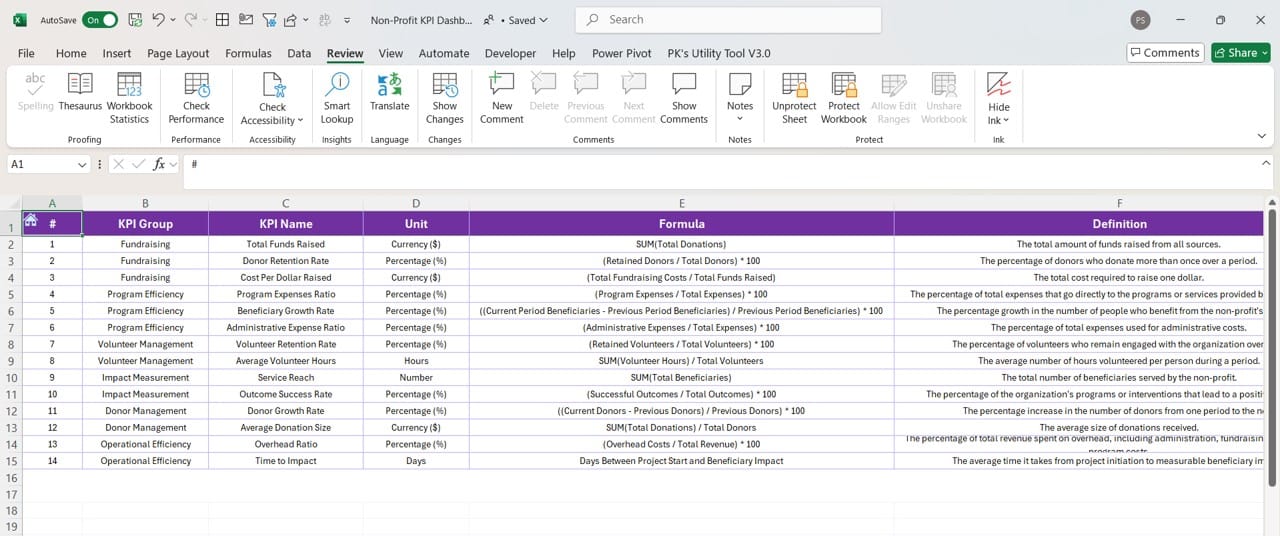
Provides a clear understanding of each KPI’s group, unit, formula, and definition for transparency and consistency.
Read the detailed blog post