Managing procurement efficiently is essential for businesses to maintain their supply chain, control costs, and meet organizational objectives. One of the most effective ways to track procurement activities is by using a Procurement KPI Dashboard. This dashboard consolidates all key performance indicators (KPIs) related to procurement and provides an overview of performance, helping decision-makers understand how well procurement functions are aligned with company goals.
In this article, we will walk through the importance of a Procurement KPI Dashboard, the best practices for creating and using it, and how to make improvements based on your data. We’ll also showcase how to use the Procurement KPI Dashboard effectively to track monthly and yearly data and make better procurement decisions.
What is a Procurement KPI Dashboard?
A Procurement KPI Dashboard is a powerful tool designed to track, monitor, and display the most important metrics related to procurement. It provides real-time insights into how well procurement activities are performing, how suppliers are delivering, and whether cost-saving targets are being met.
The dashboard serves as a central hub for procurement data, where teams can easily track metrics such as purchase order cycle time, supplier lead time, procurement cost savings, and supplier quality.
Key Features of a Procurement KPI Dashboard
To help procurement managers efficiently track and manage their activities, a well-designed dashboard must include the following key features:
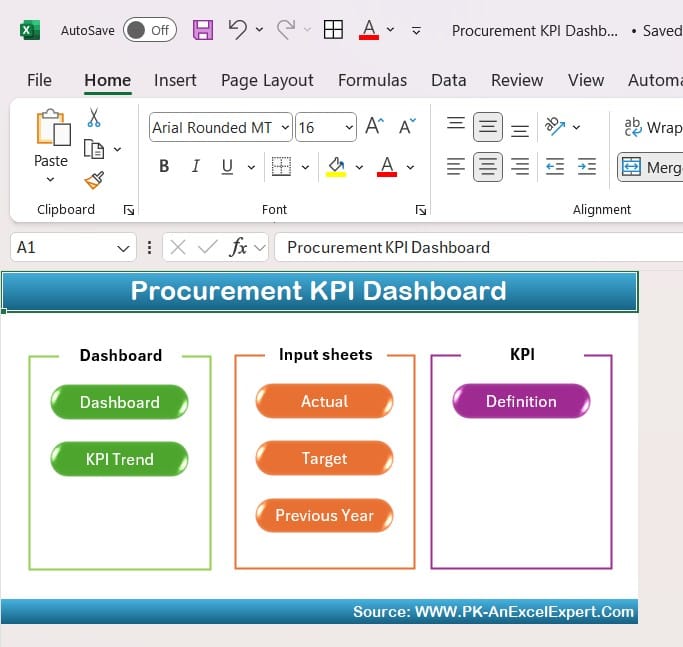
- Home Sheet
The home sheet acts as an index for the entire dashboard, providing easy navigation between different sections. It includes buttons that allow users to jump directly to different sheets such as the Dashboard, KPI trends, and data entry sections.
Click to buy Procurement KPI Dashboard In Excel
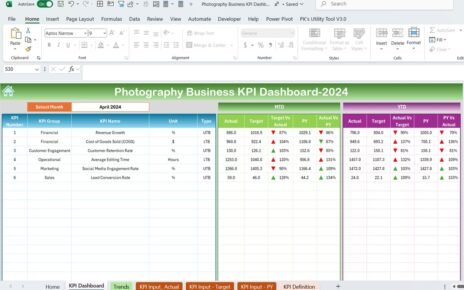
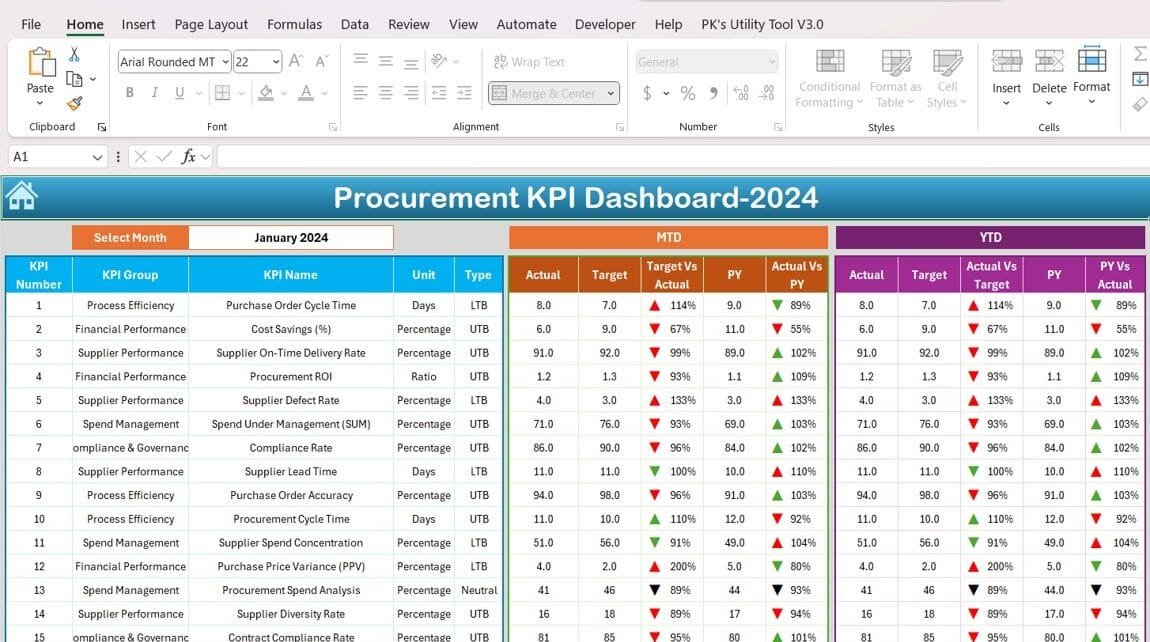
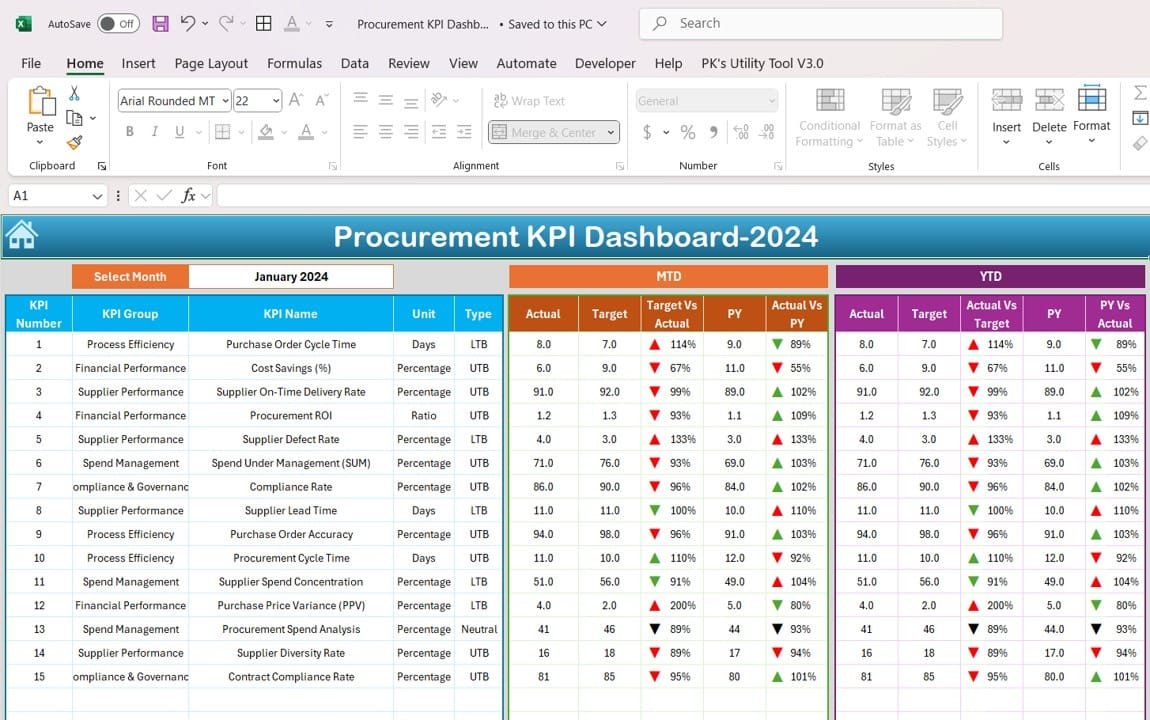
- Dashboard Sheet
This is the core of the Procurement KPI Dashboard. Here, all the essential KPIs are displayed, allowing you to monitor performance in real-time. Users can:
Select the month for which they want to view procurement data.
View Month-to-Date (MTD) and Year-to-Date (YTD) actual figures and targets.
Compare current performance against previous year’s data.
Visualize performance trends using conditional formatting with arrows to show upward or downward trends.
Click to buy Procurement KPI Dashboard In Excel
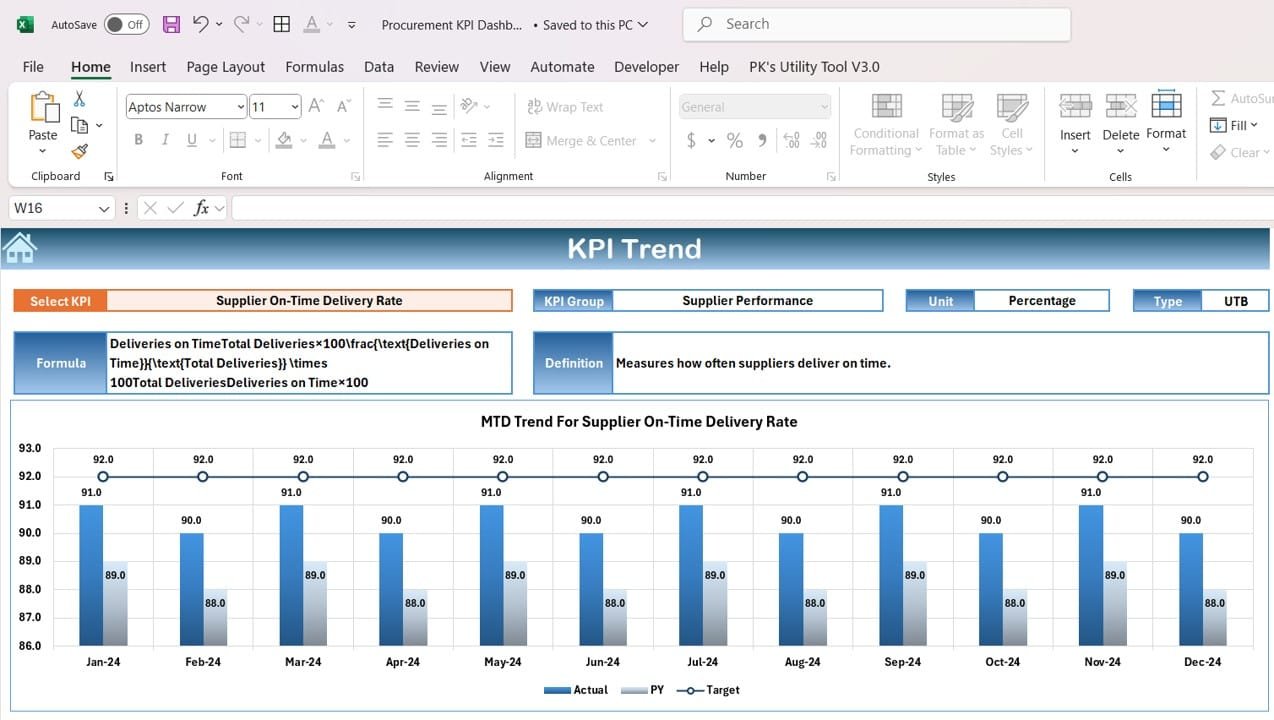
- KPI Trend Sheet
This sheet allows for more in-depth tracking of individual KPIs. Users can:
Select a specific KPI from a dropdown.
See the KPI’s group, unit, type (whether higher or lower is better), formula, and definition.
Track KPI performance over time, gaining valuable insights into procurement efficiency.
Click to buy Procurement KPI Dashboard In Excel
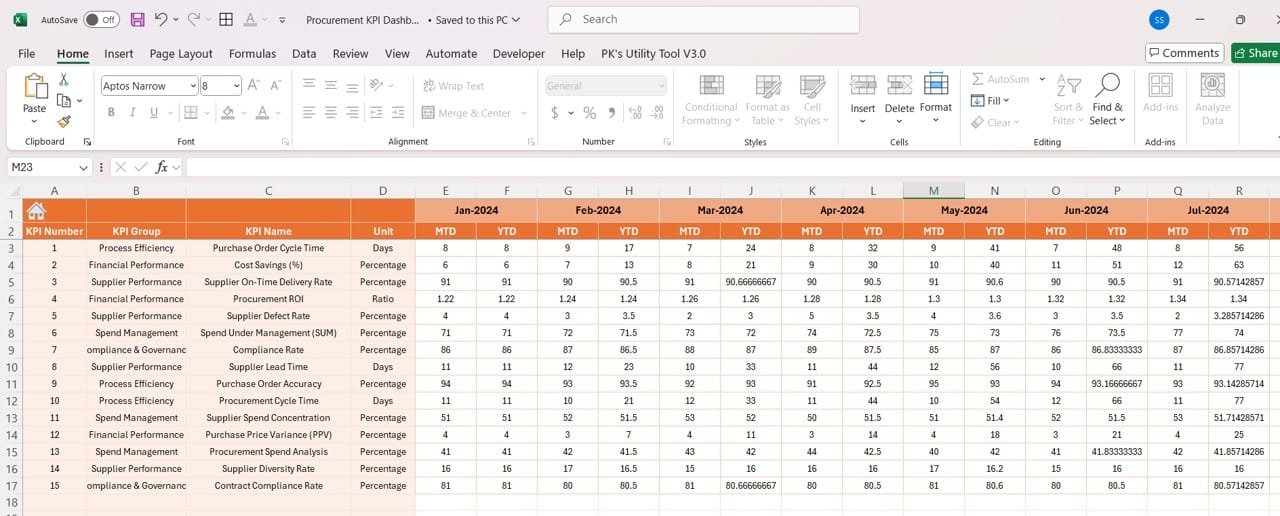
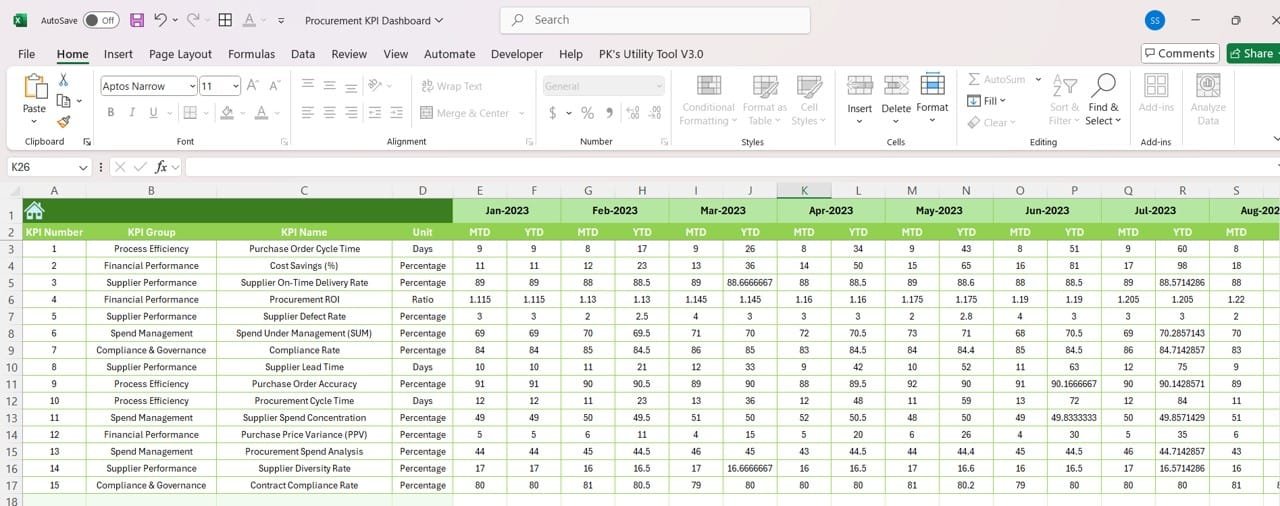
- Actual Numbers Sheet
This is where you input the actual numbers for procurement performance. It’s essential for tracking both MTD and YTD performance across months. Users can change the month from a dropdown, allowing the dashboard to reflect current performance quickly.
Click to buy Procurement KPI Dashboard In Excel
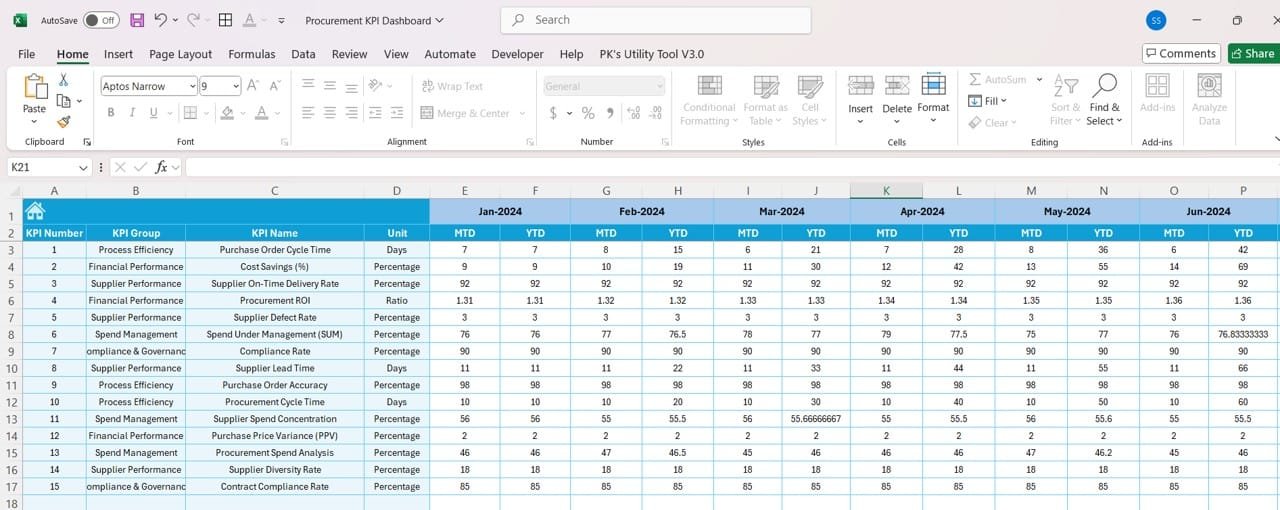
- Target Numbers Sheet
Here, procurement managers input the target numbers for each KPI, both MTD and YTD, ensuring they have goals to measure actual performance against.
Click to buy Procurement KPI Dashboard In Excel
- Previous Year Numbers Sheet
In this sheet, you can input the numbers for the previous year, allowing for easy year-over-year comparisons.
Click to buy Procurement KPI Dashboard In Excel
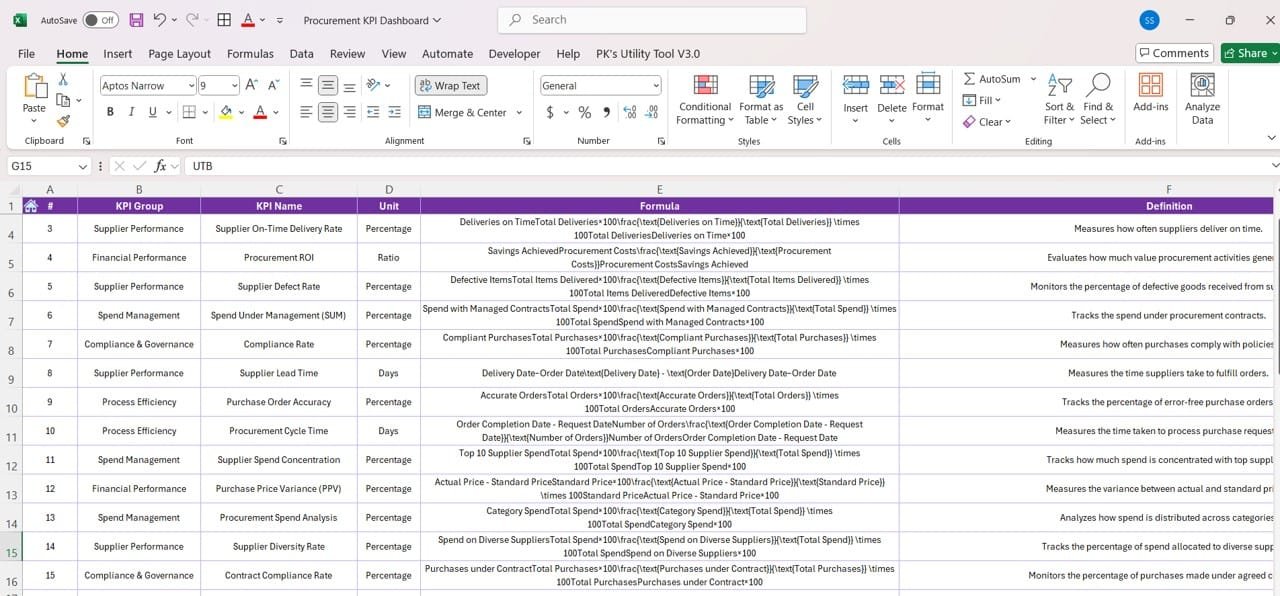
- KPI Definition Sheet
This sheet is critical for clearly defining each KPI. It includes the KPI’s name, group, unit, and formula, providing all team members with a consistent understanding of the metrics being tracked.
Click to buy Procurement KPI Dashboard In Excel
Advantages of Using a Procurement KPI Dashboard
A Procurement KPI Dashboard offers several important benefits that help organizations improve their procurement operations. Some of the key advantages include:
- Improved Visibility
The dashboard provides clear visibility into procurement performance, allowing you to quickly see whether you’re meeting targets.
- Real-Time Tracking
With real-time data, you can instantly see how your procurement department is performing and make adjustments as needed.
- Data-Driven Decision Making
Having access to all your procurement KPIs in one place allows for data-driven decisions that can help reduce costs, improve supplier relationships, and increase efficiency.
- Identify Trends
The dashboard helps you track trends over time, making it easy to spot issues before they become major problems.
- Better Supplier Management
By monitoring supplier performance metrics, you can quickly identify underperforming suppliers and make informed decisions about maintaining or changing suppliers.
Best Practices for Using a Procurement KPI Dashboard
To make the most out of your Procurement KPI Dashboard, it’s important to follow some best practices:
- Select the Right KPIs
Choosing the right KPIs is crucial. The KPIs you select should align with your overall procurement goals. Common KPIs for procurement include:
- Purchase Order Cycle Time: How long it takes to complete a purchase order.
- Supplier Lead Time: The time suppliers take to deliver goods.
- Procurement Cost Savings: How much money is saved through procurement activities.
- Supplier Quality: Measures of supplier defects and returns.
- Set Clear Targets
Each KPI should have a clearly defined target. This allows you to measure performance against a specific goal. Without targets, it’s difficult to know whether procurement activities are succeeding or failing.
- Use Conditional Formatting
Conditional formatting can visually highlight trends and performance. For example, you can use arrows or color-coded cells to indicate whether KPIs are improving or declining.
- Update Data Regularly
The Procurement KPI Dashboard should be updated regularly with new data to provide accurate and relevant insights. Monthly updates are ideal for tracking progress, but some KPIs may require weekly or even daily updates.
- Analyze Trends Over Time
Looking at MTD and YTD data helps identify trends and seasonal variations in procurement. Use the KPI trend sheet to understand how procurement performance changes over time.
Opportunity for Improvement in Procurement KPI Dashboards
Even though Procurement KPI Dashboards are effective, there’s always room for improvement. Some areas to focus on include:
- Customization
The dashboard should be customizable to the unique needs of your organization. Procurement departments in different industries may have different priorities, so a one-size-fits-all dashboard may not be ideal.
- Automation
Automating data entry can save time and reduce errors. Consider using Google Sheets or Excel integrations to automatically pull data from your procurement system into the dashboard.
- Supplier-Specific KPIs
To improve supplier management, consider adding supplier-specific KPIs. This could include metrics such as on-time delivery rate, price variance, and contract compliance.
- Advanced Reporting
Adding advanced reporting features such as charts and graphs can make the dashboard more user-friendly and easier to interpret. Visual elements help stakeholders quickly understand the data.
Best KPIs to Track in Your Procurement Dashboard
While every organization may have its own priorities, some KPIs are essential for any procurement dashboard. Here’s a list of some of the most important ones:
- Purchase Order Cycle Time: Measures how quickly purchase orders are processed.
- Procurement Cost Savings: Tracks the amount saved through efficient procurement strategies.
- Supplier Lead Time: Monitors how long suppliers take to fulfill orders.
- Supplier Defects: Tracks the number of defective products received from suppliers.
- Procurement ROI: Measures the return on investment of procurement activities.
Best Practices for Procurement Data Collection
Accurate data collection is crucial for the success of a Procurement KPI Dashboard. Here are some best practices to ensure data accuracy and completeness:
- Automate Data Collection
Use software tools to automate data collection. Manual data entry can introduce errors and takes valuable time.
- Standardize Data Formats
Ensure that all data is entered in a standardized format. For example, ensure dates, currency values, and unit measurements are consistent across all entries.
- Regular Data Audits
Conduct regular audits of your data to ensure it is accurate and up-to-date. This is especially important when dealing with financial data.
- Involve All Stakeholders
Procurement data often involves input from different departments. Ensure that all stakeholders are involved in the data collection process to provide a complete picture.
Conclusion
A well-designed Procurement KPI Dashboard is a powerful tool that helps organizations track procurement performance, reduce costs, and improve supplier relationships. By selecting the right KPIs, regularly updating data, and following best practices, you can create a dashboard that provides actionable insights into your procurement operations.
Remember that the key to an effective dashboard is customization. Make sure your dashboard reflects the unique needs of your organization and is designed to evolve as your business grows.
Frequently Asked Questions (FAQs)
Q. What is a Procurement KPI Dashboard?
A Procurement KPI Dashboard is a tool used to track and display key performance indicators related to procurement activities, helping organizations monitor supplier performance, procurement costs, and efficiency.
Q. Which KPIs should I track in a Procurement Dashboard?
Key KPIs include purchase order cycle time, procurement cost savings, supplier lead time, supplier quality, and procurement ROI.
Q. How often should I update my Procurement KPI Dashboard?
It’s best to update your dashboard monthly. However, for more time-sensitive metrics, such as supplier lead time or cost savings, weekly or daily updates may be necessary.
Visit our YouTube channel to learn step-by-step video tutorials
Click to buy Procurement KPI Dashboard In Excel