In the hospitality industry, success doesn’t just happen overnight. It’s built on key elements like guest satisfaction, operational efficiency, and managing revenue effectively. However, tracking all these areas without the right tools can feel overwhelming. That’s where the Hospitality KPI Dashboard comes in. KPIs (Key Performance Indicators) are the crucial numbers that help you measure success, and a well-designed dashboard allows you to track, analyze, and improve your performance in real-time. In this guide, we’ll walk through everything you need to know about building a useful and user-friendly Hospitality KPI Dashboard.
What is a Hospitality KPI Dashboard?
Think of the Hospitality KPI Dashboard as your all-in-one toolkit for understanding how well your hospitality business is doing. It tracks vital metrics like occupancy rates, revenue per available room (RevPAR), guest satisfaction scores, and more. With this dashboard, you get a clear picture of your operations, allowing you to make informed, data-driven decisions that can improve efficiency, enhance the guest experience, and boost your overall financial performance.
This dashboard includes seven worksheets, each designed for a specific purpose. Let’s dive into each one and explain how they help manage KPIs effectively.
Key Features of the Hospitality KPI Dashboard
Here’s a breakdown of the key features of the Hospitality KPI Dashboard, organized into seven important worksheets:
-
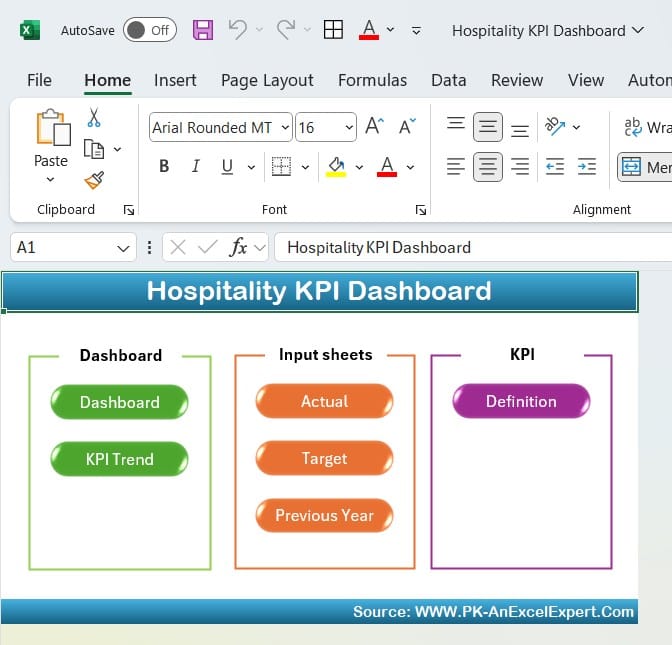
Home Sheet
The Home sheet is like the starting page of your dashboard. It has six buttons that allow you to quickly move between sections of the dashboard. No more scrolling through endless tabs—you can jump straight to the data you need with just a click. This makes navigation super easy and saves valuable time, especially when managing multiple KPIs.
-
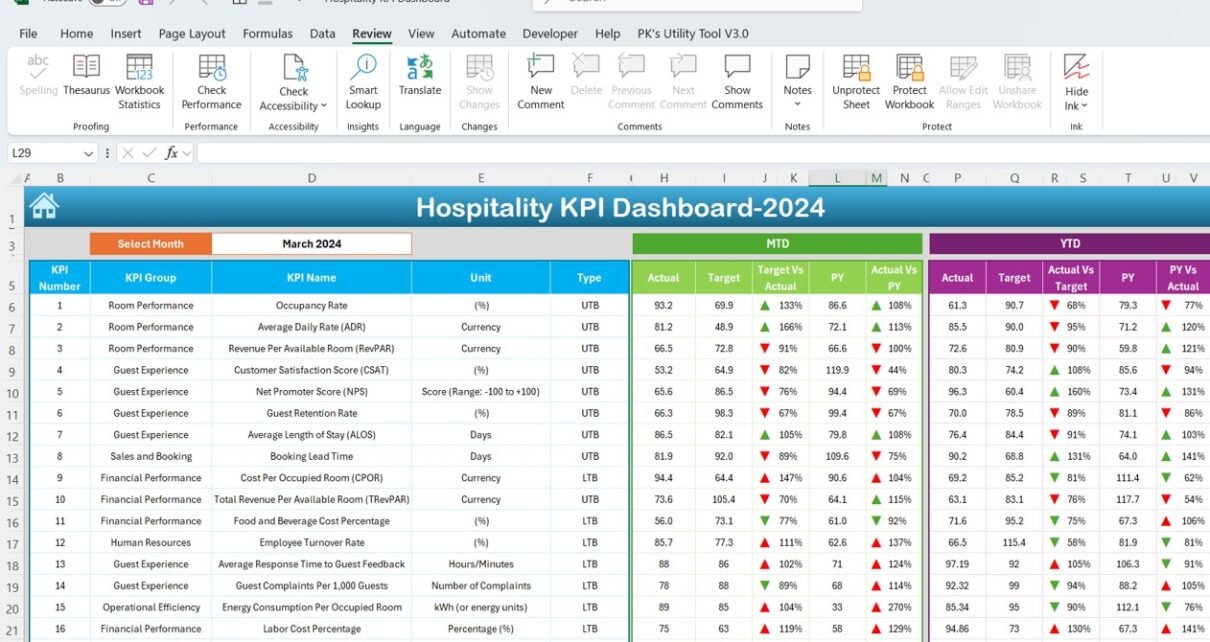
Dashboard Sheet Tab
The Dashboard sheet is the heart of the KPI dashboard. It gives you a top-level view of all your KPIs. You can select the month from a drop-down menu (in cell D3), and the entire dashboard updates automatically with data for that specific month.
The dashboard shows:
- Month-to-Date (MTD) Actual: What’s been achieved this month so far.
- MTD Target: The goal or target set for the month.
- Previous Year Data: Performance for the same month in the previous year.
- Year-to-Date (YTD) Actual: How your business has performed throughout the year.
- YTD Target: The goal for the entire year.
- YTD Previous Year: Last year’s performance for the same period.
The dashboard also uses conditional formatting with up and down arrows to show if performance is better or worse compared to the target or last year’s data. These visual cues help you quickly assess performance and identify areas needing improvement.

-
KPI Trend Sheet Tab
The KPI Trend sheet is where you can dive deeper into individual KPIs. You can select any KPI from the drop-down list in cell C3 to get details such as:
- KPI Group: The category the KPI belongs to.
- Unit of Measurement: Whether the KPI is measured in percentages, dollars, or other units.
- KPI Type: Whether higher values (like revenue) are better, or lower values (like guest complaints) are preferred.
- Formula: The formula used to calculate the KPI.
- Definition: A clear explanation of what the KPI measures.
This sheet is perfect for analyzing trends over time and ensuring that everyone in the organization understands the metrics in the same way.

-
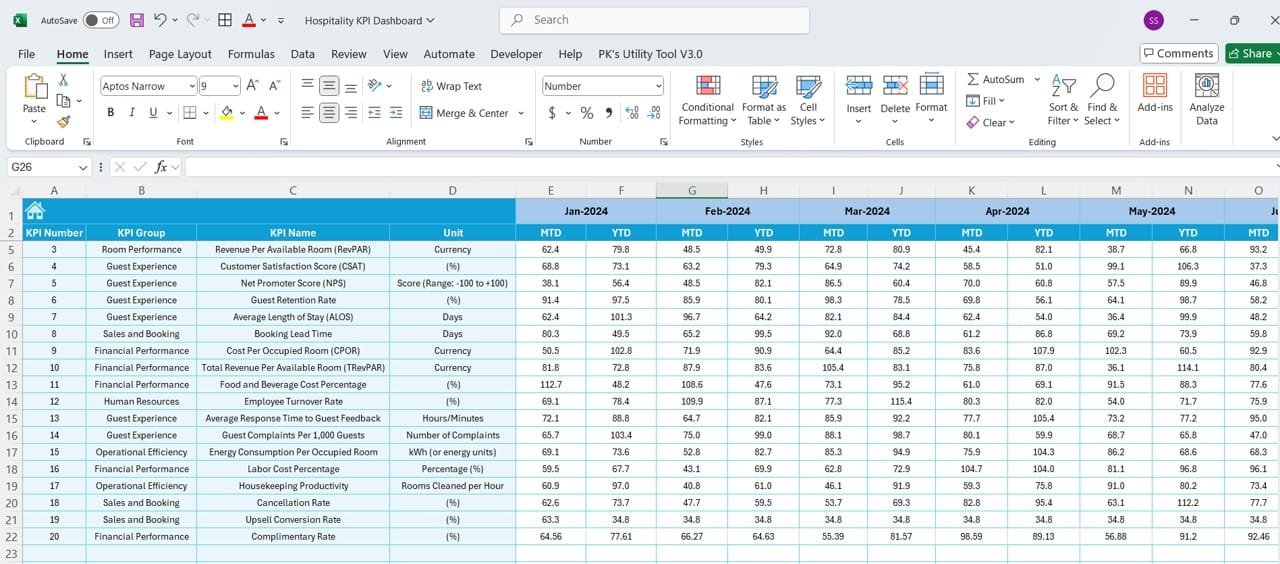
Actual Number Sheet Tab
The Actual Number sheet is where you input the real performance data for each KPI. You can enter both monthly (MTD) and yearly (YTD) numbers. It’s designed to be flexible—by entering the first month of the year in cell E1, you can adjust the starting point of the data. This feature is handy for businesses that don’t follow the traditional calendar year.

-
Target Sheet Tab
The Target sheet is where you set your goals. Here, you can enter both monthly and yearly targets for each KPI. When you place targets next to your actual data, you can quickly see if your hospitality business is on track or if adjustments are needed.
-
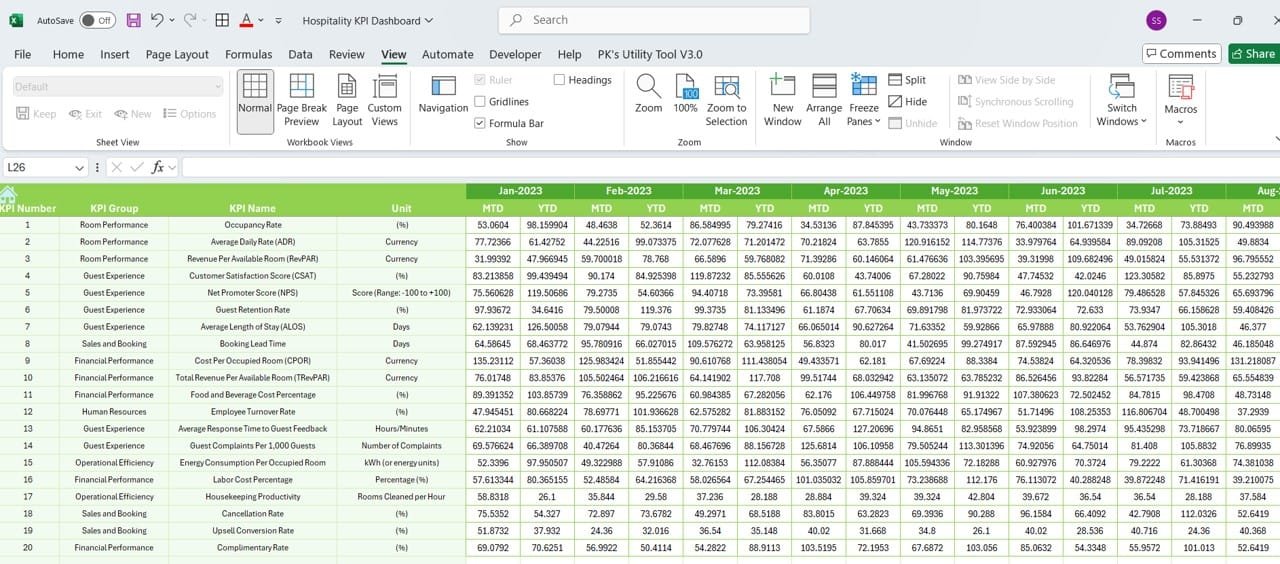
Previous Year Number Sheet Tab
The Previous Year Number sheet lets you compare this year’s data with last year’s performance. This comparison helps you track improvements or spot declines, giving you a clear picture of how your business is evolving over time.
-
KPI Definition Sheet Tab
The KPI Definition sheet ensures that everyone in your team interprets KPIs consistently. This sheet includes:
The name of each KPI.
The KPI group or category.
The unit of measurement.
The formula for calculating the KPI.
A clear definition of what each KPI measures.
Having these definitions prevents confusion and ensures everyone is on the same page about what each metric represents.

Advantages of Using a Hospitality KPI Dashboard
Now that you know how the dashboard works, let’s explore the benefits of using one for your hospitality business:
-
Centralized Performance Tracking
The biggest advantage of a KPI dashboard is that it consolidates all your important metrics into one place. Instead of juggling different reports or spreadsheets, you can monitor everything from guest satisfaction to revenue in one central dashboard. This makes decision-making faster and more efficient.
-
Real-Time Data
Since the dashboard allows you to select a month and see updated data in real-time, you’re always working with the most current information. This means you can make timely adjustments to your strategy, which is essential in a fast-paced industry like hospitality.
-
Visual Insights
The use of conditional formatting and up/down arrows gives you instant visual cues about how your business is doing. You can easily spot areas that need attention or opportunities for improvement, without having to sift through tons of data.
-
Improved Accountability
Having clear performance targets and actual data displayed side by side promotes accountability across your teams. Everyone can see whether or not they’re hitting their KPIs, creating a culture of transparency and responsibility.
-
Historical Comparisons
The ability to compare current data with last year’s performance helps you understand what’s working and what needs adjustment. It provides valuable context for evaluating the effectiveness of your strategies over time.
Best Practices for Using a Hospitality KPI Dashboard
To get the most out of your Hospitality KPI Dashboard, here are some best practices to follow:
- Update Data Regularly: Make sure you update the performance numbers and targets frequently to keep the dashboard reliable and accurate.
- Maintain Consistent Definitions: Ensure everyone in the organization understands what each KPI means by referring to the KPI Definition sheet regularly.
- Leverage Visual Indicators: Use the arrows and conditional formatting to get quick insights, saving time on in-depth data analysis.
- Set Realistic Targets: It’s great to aim high, but your targets should also be achievable. Use historical data to guide your goal-setting process.
Opportunities for Improvement in the Hospitality KPI Dashboard
While the Hospitality KPI Dashboard is incredibly useful, there’s always room for improvement. Here are some potential upgrades:
-
Automation
Manually entering data can be time-consuming. By integrating the dashboard with real-time reporting systems, you can automate data entry, saving time and reducing the risk of errors.
-
Enhanced Visualization
Currently, the dashboard uses basic visual cues like arrows. Adding more advanced tools, such as interactive graphs or charts, could make the dashboard even more user-friendly.
-
Custom KPI Groups
Different businesses focus on different KPIs. Allowing users to create custom KPI groups would provide more flexibility, especially for larger organizations with diverse needs.
-
Mobile Compatibility
Today’s decision-makers are constantly on the go. Making the dashboard mobile-friendly would allow you to access data anytime, anywhere, improving its practicality.
Best Practices for Setting KPIs in the Hospitality Industry
Setting the right KPIs is just as important as tracking them. Here are some best practices for setting effective KPIs:
- Set SMART KPIs: Make sure your KPIs are Specific, Measurable, Achievable, Relevant, and Time-bound to keep your goals focused and actionable.
- Involve Key Stakeholders: When setting KPIs, include input from all relevant departments to ensure the metrics reflect the business’s overall performance.
- Review KPIs Regularly: As your business evolves, so should your KPIs. Regularly review and adjust them to keep them aligned with your goals.
- Focus on Accountability: KPIs should reflect both internal expectations and guest satisfaction. Make sure you’re tracking metrics that measure both operational efficiency and guest experiences.
Visit our YouTube channel to learn step-by-step video tutorials