In today’s fast-paced sports world, tracking performance metrics is more important than ever. Whether you’re a coach, sports analyst, or manager, having a tool that helps you monitor and analyze Key Performance Indicators (KPIs) is crucial. A well-designed Sports KPI Dashboard in Excel allows you to easily manage and evaluate important metrics, making it an essential tool for any sports team or athlete.
In this article, we will dive deep into the Sports KPI Dashboard in Excel, a ready-to-use template that simplifies performance tracking. We’ll cover its features, advantages, best practices, areas of improvement, and answer some frequently asked questions.
Click to buy Sports KPI Dashboard in Excel
What is a Sports KPI Dashboard?
A Sports KPI Dashboard is a tool that consolidates various performance metrics, or KPIs, into one place. These KPIs are used to measure how well athletes or teams are performing, providing valuable insights into areas like game performance, training progress, and even injury prevention.
Using Excel for this dashboard provides several benefits. It allows for easy customization, dynamic data visualization, and simple updates. The flexibility of Excel makes it a popular choice for tracking sports performance, as it can adapt to various needs and sports categories.
Click to buy Sports KPI Dashboard in Excel
Key Features of the Sports KPI Dashboard in Excel
This Sports KPI Dashboard includes seven different worksheets, each designed to simplify data management and performance tracking. Let’s explore each one:
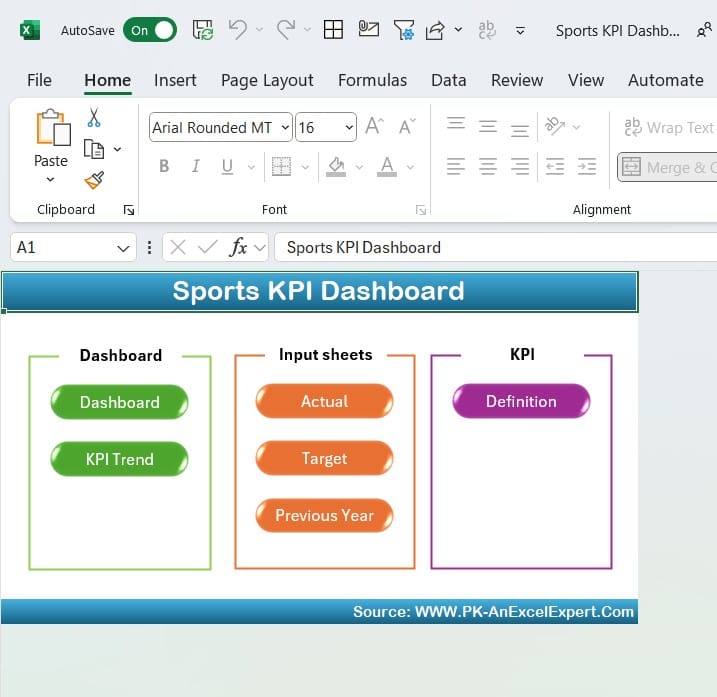
Home Sheet
Click to buy Sports KPI Dashboard in Excel
The Home Sheet serves as the navigation hub of the dashboard. It is the index sheet, where you’ll find six buttons that allow you to quickly jump to the other sheets in the workbook. This feature makes it easy to switch between different sections of the dashboard without needing to scroll through multiple tabs.
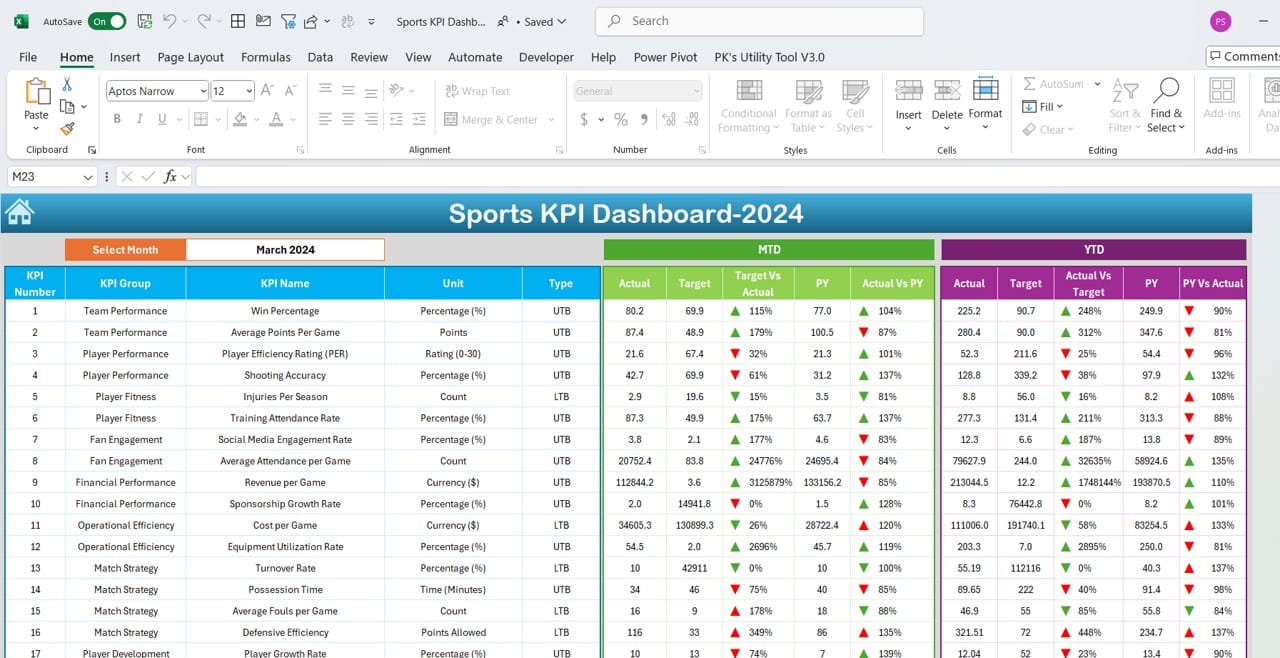
Dashboard Sheet
Click to buy Sports KPI Dashboard in Excel
The Dashboard Sheet is the heart of this KPI Dashboard. This sheet is where all the key performance indicators are displayed, and it offers a clear view of your data.
- Month Selection: In cell D3, you can select a month from the dropdown, and the entire dashboard will update based on the selected month’s data.
- MTD and YTD Data: It displays Month-to-Date (MTD) and Year-to-Date (YTD) data for Actuals, Targets, and Previous Year (PY) numbers. You can compare how current performance stacks up against past and targeted numbers.
- Conditional Formatting: Up and down arrows are used to visually show whether the performance is on track (Target vs Actual) or improving compared to last year (PY vs Actual).
This feature makes it easy to monitor trends and take immediate action if needed.
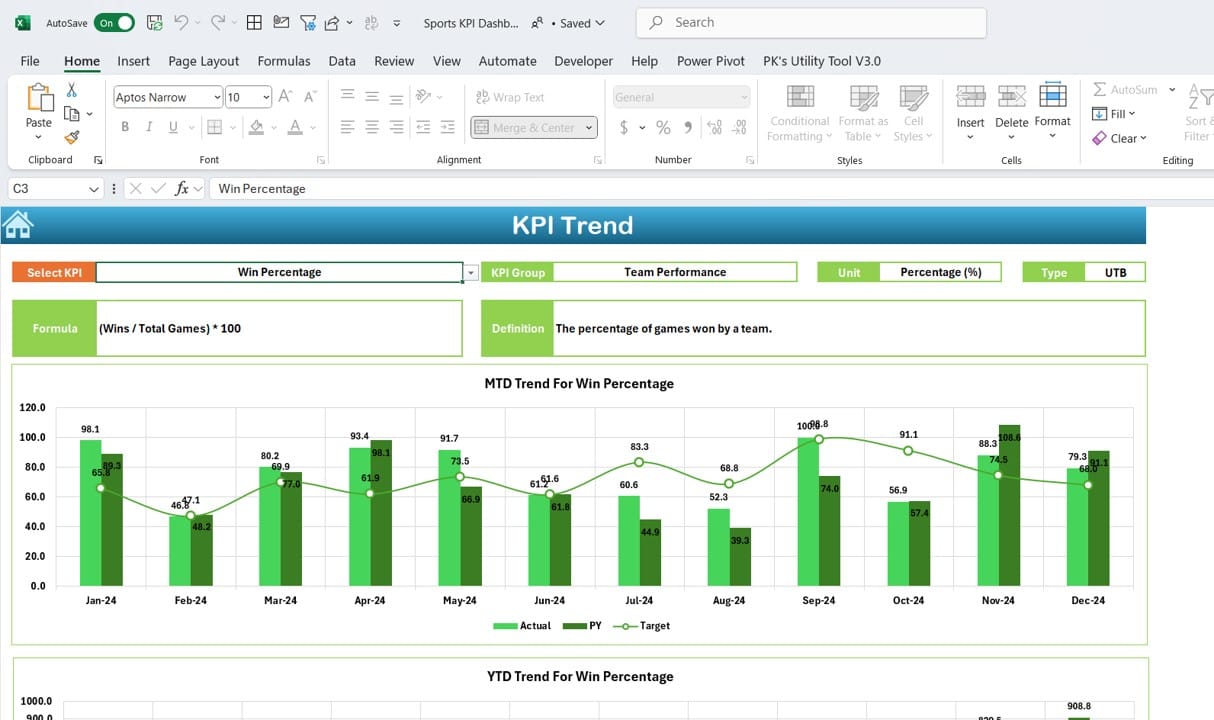
KPI Trend Sheet
Click to buy Sports KPI Dashboard in Excel
The KPI Trend Sheet is where you can track how each KPI has performed over time. Here’s what you can do:
- KPI Selection: In cell C3, you can select the specific KPI you want to track from a dropdown. The sheet will then show all relevant details for that KPI, including the KPI Group, Unit, whether it’s better to have a higher or lower value, the Formula used, and its Definition.
- Trend Charts: You’ll also find trend charts that display MTD and YTD performance over time, making it easy to spot patterns, improvements, or declines.
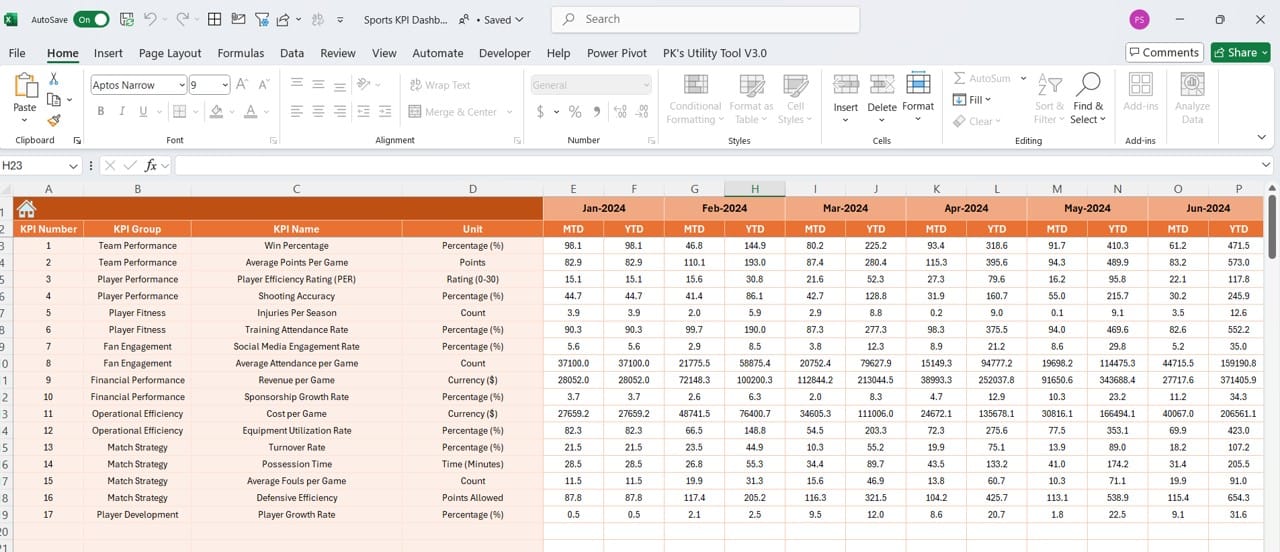
Actual Numbers Input Sheet
Click to buy Sports KPI Dashboard in Excel
Data accuracy is crucial for tracking KPIs. The Actual Numbers Input Sheet is where you’ll enter the real numbers for each month.
- Month Selection: You can change the month by selecting the first month of the year in cell E1. This ensures that the dashboard updates correctly for the selected period.
- Input MTD and YTD: Enter the actual MTD and YTD figures here for each KPI. This data is then reflected throughout the entire dashboard.
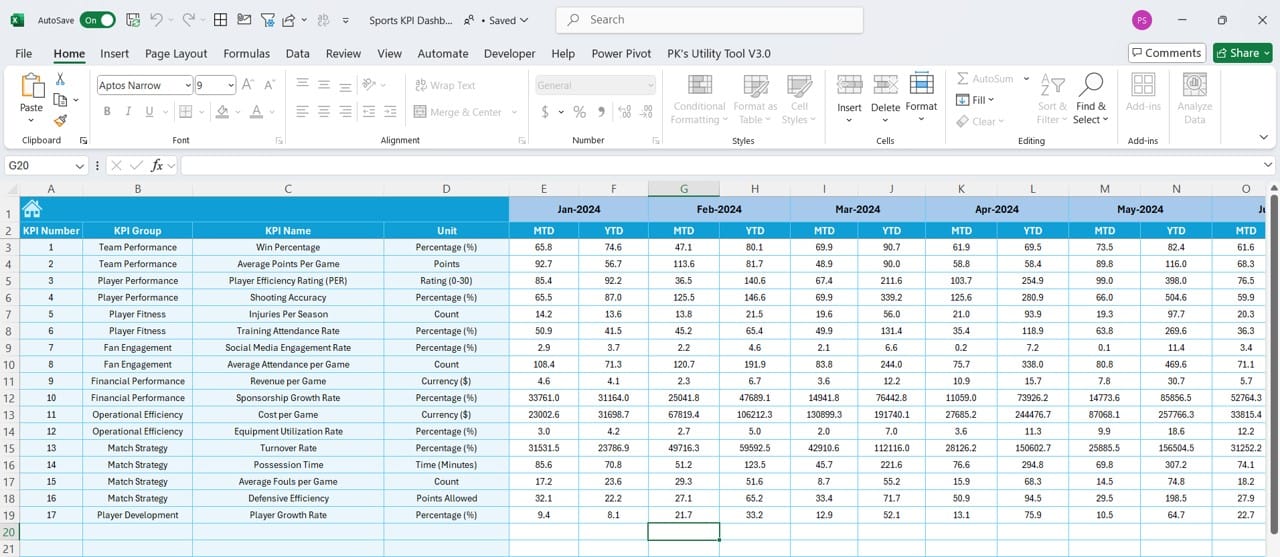
Target Sheet
Click to buy Sports KPI Dashboard in Excel
In the Target Sheet, you’ll enter the target values for each KPI for both MTD and YTD. This allows you to set goals and monitor how well athletes or teams are meeting these targets. Accurate targets are essential for effective performance analysis.
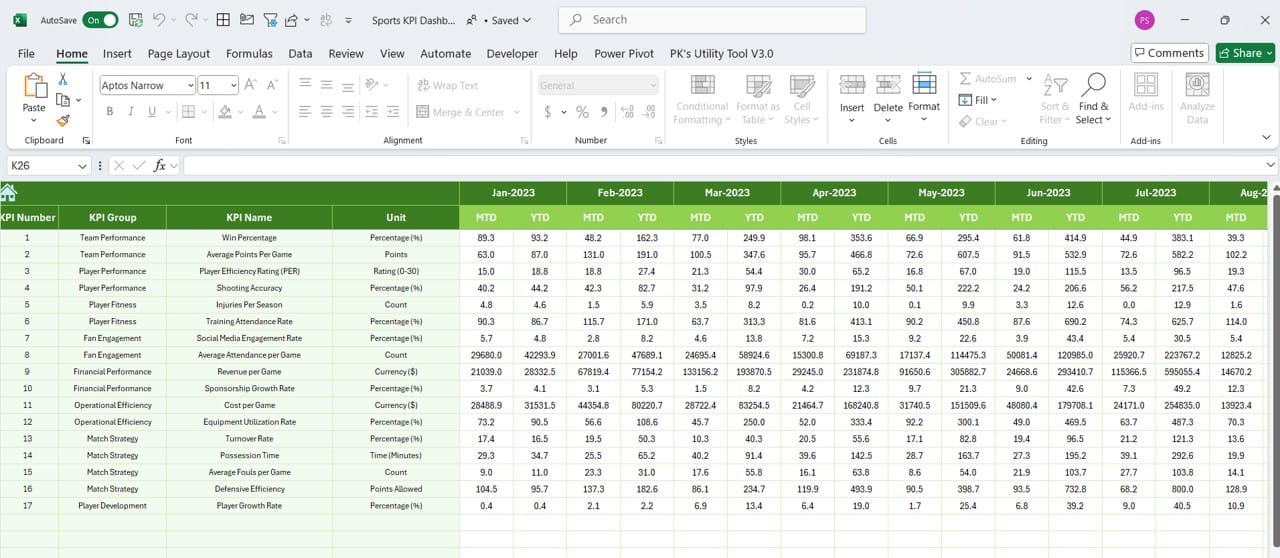
Previous Year Numbers Sheet
Click to buy Sports KPI Dashboard in Excel
This sheet helps you compare current performance to last year’s numbers. Enter the Previous Year’s MTD and YTD values in the same format as you entered the current year’s data. This makes it easier to track progress and spot trends.
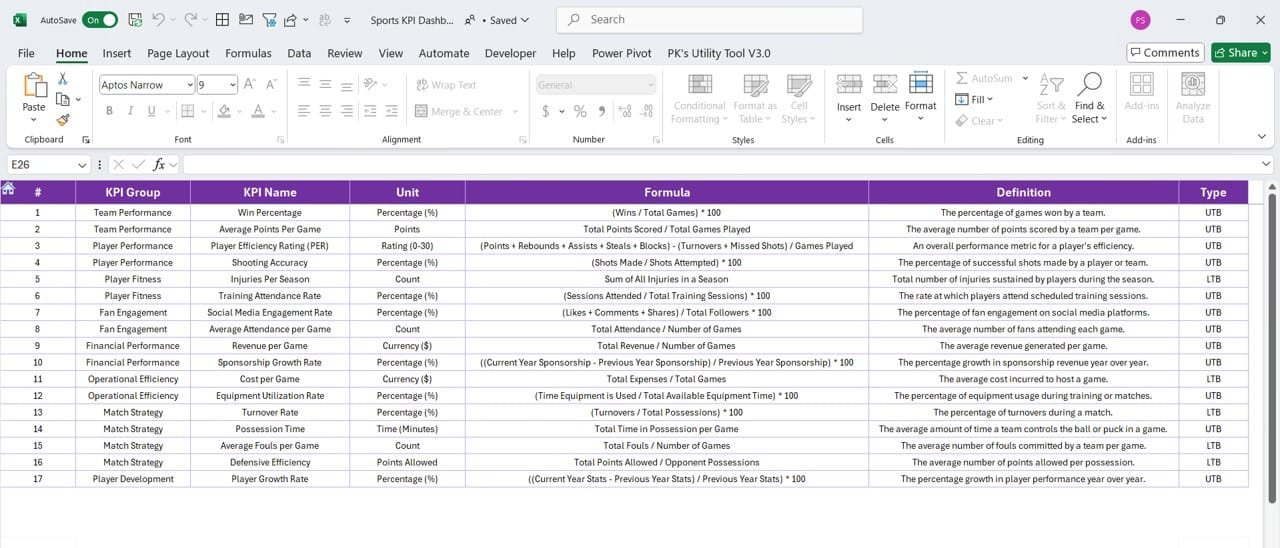
KPI Definition Sheet
Click to buy Sports KPI Dashboard in Excel
The KPI Definition Sheet is where all your KPIs are clearly defined. It includes the KPI Name, Group, Unit, Formula, and Definition. Having this information in one place ensures that everyone on the team understands what each KPI measures and how it is calculated.
Advantages of Using a Sports KPI Dashboard in Excel
Now that we’ve covered the features, let’s look at the benefits of using this Sports KPI Dashboard in Excel. There are many advantages to having a centralized tool to track sports performance, but here are some of the most important ones:
- Real-Time Performance Tracking: You can monitor performance in real time, giving you the ability to make adjustments as needed. For example, if you notice a decline in performance mid-season, you can address the issue before it becomes a bigger problem.
- Simplified Data Comparison: Comparing current performance to past results or target goals is straightforward. You can easily spot gaps and take necessary actions to improve.
- Better Decision-Making: With all the data at your fingertips, you can make data-driven decisions. You no longer have to rely on intuition alone when evaluating player or team performance.
- Customizable for Different Sports: Whether you’re managing a football team or a swimming squad, this dashboard is flexible enough to adapt to any sport. You can easily add or remove KPIs to suit your specific needs.
Best Practices for Using a Sports KPI Dashboard
To get the most out of your Sports KPI Dashboard, there are some best practices you should follow:
- Regular Data Entry: Ensure that actual performance numbers are entered regularly. Missing data can lead to incorrect conclusions.
- Set Achievable Targets: When setting KPIs, it’s important to set realistic and achievable targets. While it’s good to aim high, unrealistic goals can lead to frustration.
- Analyze Historical Data: Use past data to help set future goals. Analyzing trends from previous years can provide valuable insights into potential improvements.
- Leverage Conditional Formatting: Excel’s conditional formatting feature makes it easier to highlight trends and spot important performance shifts.
Opportunities for Improvement in the Sports KPI Dashboard
While this Sports KPI Dashboard is highly effective, there’s always room for improvement. Here are a few ways you could enhance the dashboard:
- Automation: One of the biggest opportunities for improvement is automating data input. By linking the dashboard to external data sources or using VBA (Visual Basic for Applications) in Excel, you can automatically populate the data without manual input.
- Advanced Visualizations: If you want to take data analysis to the next level, consider integrating Power BI or another advanced data visualization tool. This would allow for more interactive reports and deeper insights.
- Sport-Specific Customization: Depending on the sport, you may want to add KPIs that are more relevant. For example, in team sports, you could track metrics like team cohesion, while in individual sports, you might focus more on personal bests or injury recovery times.
Conclusion
The Sports KPI Dashboard in Excel is a powerful tool that simplifies performance tracking for athletes and teams. With its dynamic charts, conditional formatting, and easy data input, this dashboard helps coaches, managers, and analysts make data-driven decisions. By regularly updating the KPIs and following best practices, this dashboard can be a game-changer in sports management.
Frequently Asked Questions (FAQs)
Click to buy Sports KPI Dashboard in Excel
Q. What is a KPI in sports?
A KPI in sports refers to a Key Performance Indicator, a measurable value that helps track the performance of an athlete or team. Common sports KPIs include metrics like win/loss ratio, average player performance, and injury recovery time.
Q. How does the Sports KPI Dashboard in Excel work?
The Sports KPI Dashboard works by consolidating various performance metrics into one place. You can enter actual numbers, compare them with targets, and track historical performance. The dashboard then uses this data to provide visual insights into how well your team or athletes are performing.
Q. Can the dashboard be customized for other sports?
Yes, the dashboard is fully customizable. You can add, remove, or modify KPIs based on the specific sport you’re managing. For example, you can track team-related KPIs for sports like football or basketball and individual performance metrics for sports like swimming or running.
Q. What are the most common KPIs used in sports?
Common KPIs in sports include win/loss ratios, points scored, penalty counts, average time per event, and player performance ratings. These indicators help coaches and managers evaluate success and identify areas for improvement.
This version keeps the language simple and clear, uses transition words effectively, and follows all the guidelines provided for the article structure.
Click to buy Sports KPI Dashboard in Excel
Visit our YouTube channel to learn step-by-step video tutorials
View this post on Instagram
Click to buy Sports KPI Dashboard in Excel