In today’s fast-paced Electronics KPI Dashboard in Excel industry, tracking performance metrics is essential for staying competitive. Having a clear view of your key performance indicators (KPIs) can help drive better decision-making, improve efficiency, and achieve your business goals. This is where an Electronics KPI Dashboard in Excel becomes a valuable tool.
In this article, we’ll explore how to use this customizable dashboard to track, manage, and analyze key performance indicators for your electronics business. By the end of this guide, you’ll not only understand how to use this dashboard but also why it’s crucial for your business growth.
Click to buy Electronics KPI Dashboard in Excel
What are an Electronics KPI Dashboard in Excel?
An Electronics KPI Dashboard is a ready-to-use Excel template designed to measure and track KPIs specific to the electronics industry. It allows you to visualize performance metrics, such as monthly and yearly trends, and compare them to set targets and previous years’ data. Whether you’re managing production, sales, or customer satisfaction, this dashboard provides a bird’s-eye view of how your business is performing.
Key Features of the Electronics KPI Dashboard
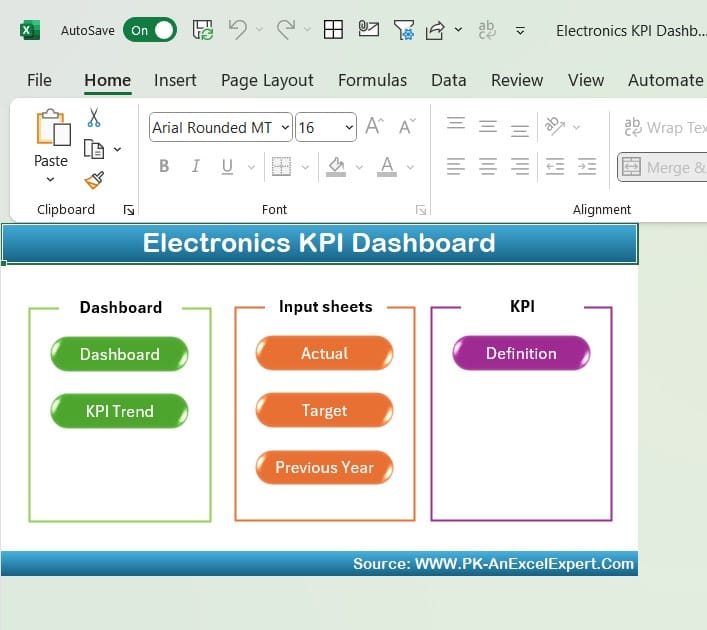
This Electronics KPI Dashboard is user-friendly and customizable to your needs. Below are the seven core worksheets included in the template and their specific functionalities:
Home Sheet
Click to buy Electronics KPI Dashboard in Excel
The Home Sheet serves as the index or navigation hub of your dashboard. From here, you can quickly jump to any of the six main sections of the dashboard with a click of a button. This makes navigating the dashboard easy and efficient, ensuring you spend less time searching for specific information.
Dashboard Sheet Tab
Click to buy Electronics KPI Dashboard in Excel
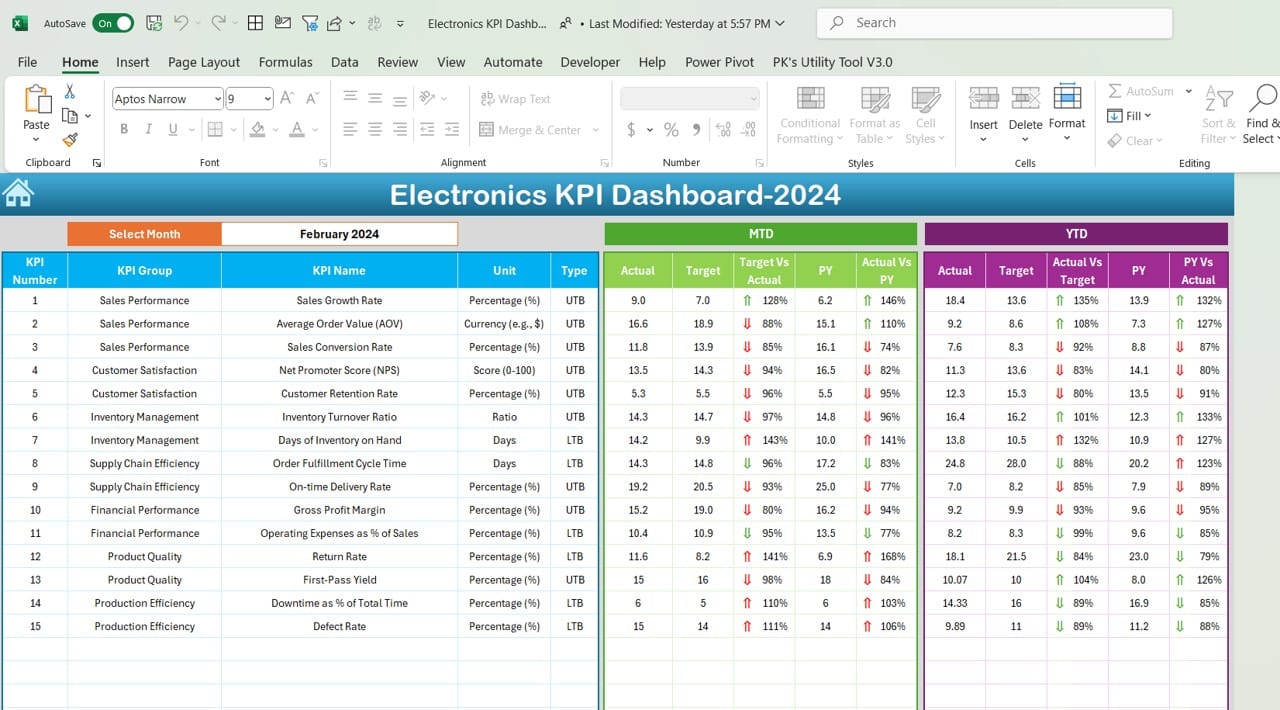
The Dashboard Sheet is the heart of the template. This is where all the essential data related to your electronics KPIs are displayed.
- Month Selection: You can select a month from the drop-down menu (cell D3), and the dashboard will automatically update to reflect the data for that particular month. This ensures that you always have the most relevant data at your fingertips.
- KPI Metrics: Here, you’ll find key metrics such as Month-to-Date (MTD) Actual, MTD Target, Previous Year (PY) Data, and comparisons between Target vs. Actual and PY vs. Actual. Conditional formatting is applied to show whether values are trending up or down with intuitive up and down arrows.
- Year-to-Date (YTD) Metrics: In addition to MTD, the sheet also includes YTD Actual, Target, PY Data, and similar comparisons to monitor long-term trends. The use of conditional formatting allows for quick insights.
Click to buy Electronics KPI Dashboard in Excel
KPI Trend Sheet Tab
Click to buy Electronics KPI Dashboard in Excel
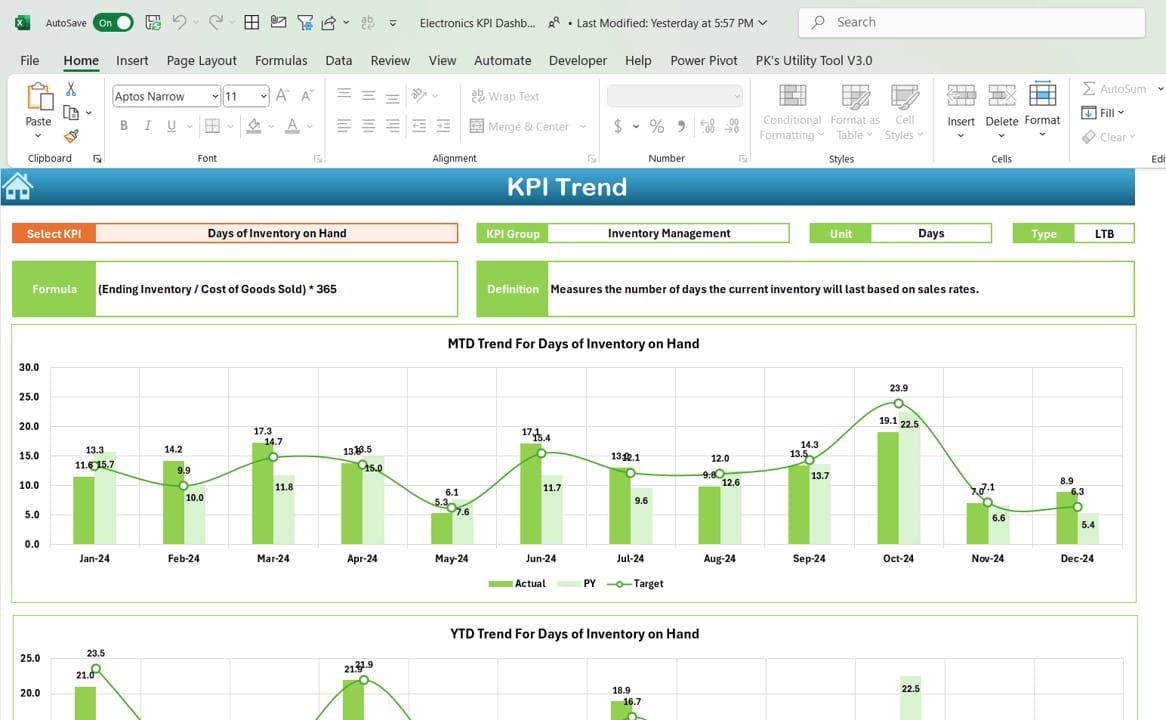
In the KPI Trend Sheet, you can delve into specific KPI metrics.
- KPI Selection: Choose the KPI from the drop-down menu in cell C3 to analyze in-depth.
- Details on KPI: You will see detailed information such as KPI Group, Unit, KPI Type (whether lower values are better or higher values are better), and the formula used to calculate the KPI.
- Trend Charts: Visualize how the selected KPI is performing with MTD and YTD charts comparing Actual, Target, and PY values. These trend charts provide a graphical representation of your data, making it easier to spot patterns and make informed decisions.
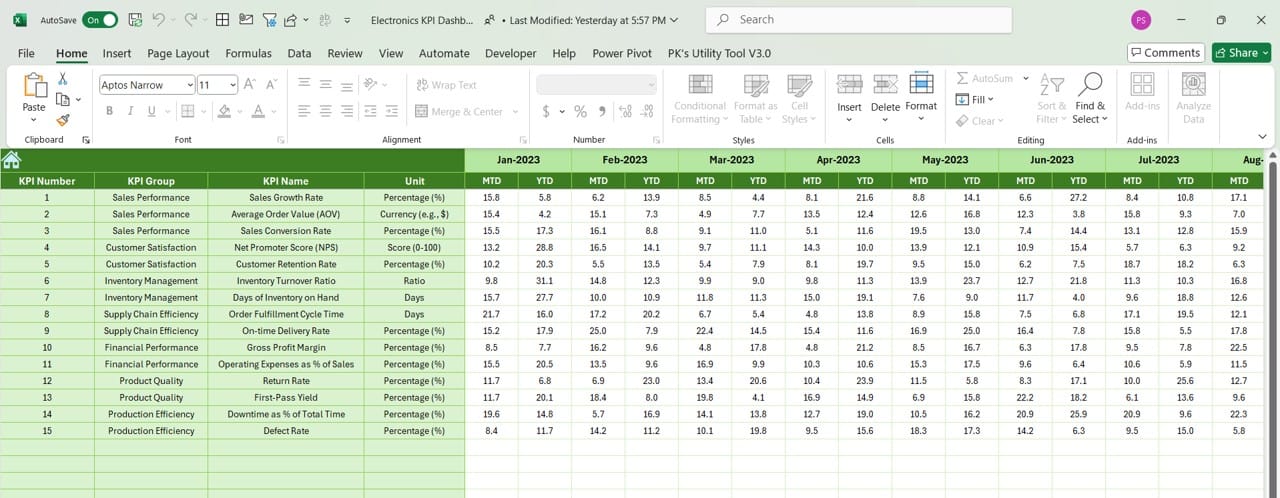
Actual Numbers Input Sheet
Click to buy Electronics KPI Dashboard in Excel
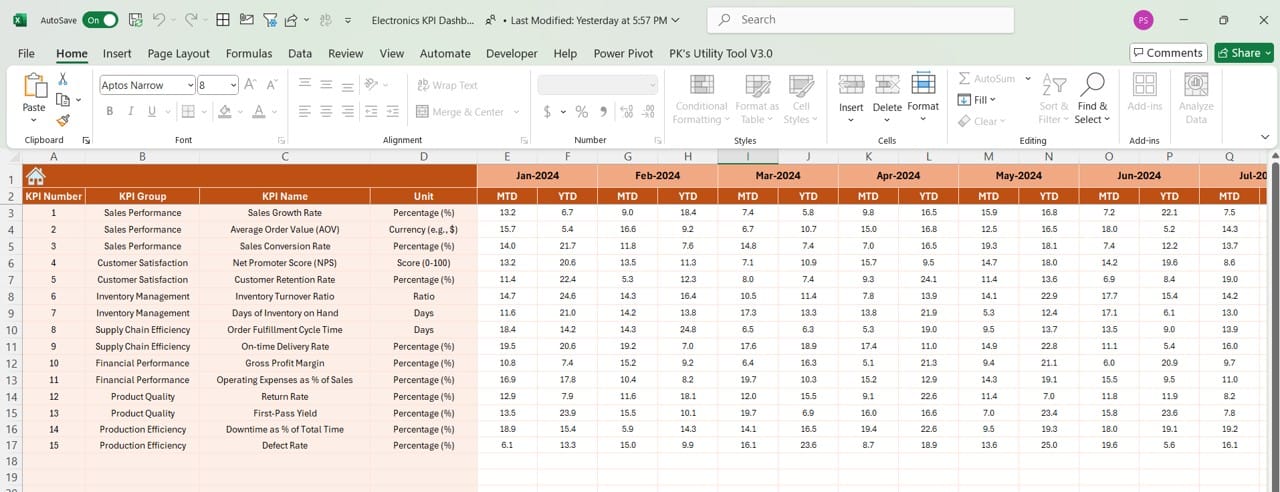
In the Actual Numbers Input Sheet, you can input your MTD and YTD actual values.
- Month Selection: Enter the starting month of your fiscal year in cell E1, and the sheet will adjust accordingly. This customization ensures flexibility for businesses with varying fiscal calendars.
- Data Entry: This is where you’ll input your actual KPI numbers for each month. By keeping this sheet updated, you ensure that the rest of the dashboard reflects accurate, up-to-date information.
Target Sheet Tab
Click to buy Electronics KPI Dashboard in Excel
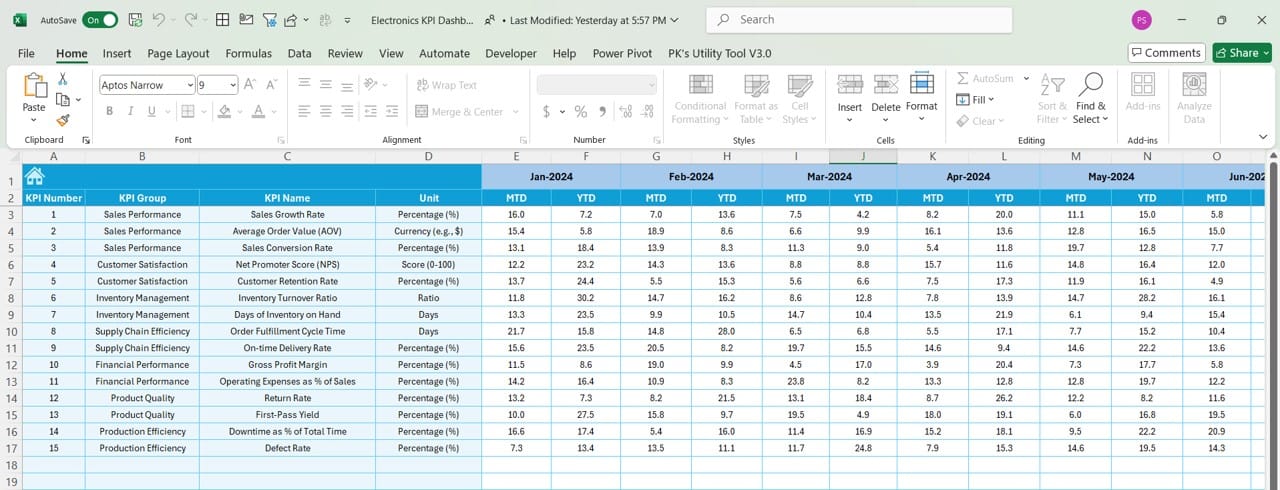
The Target Sheet allows you to set monthly and yearly targets for each KPI.
- MTD and YTD Targets: Enter the target values for each KPI for both MTD and YTD. These targets are crucial for performance comparisons and setting benchmarks for future success.
Previous Year Numbers Sheet Tab
Click to buy Electronics KPI Dashboard in Excel
Tracking your progress means comparing it to past performance. In the Previous Year Numbers Sheet, you enter data for the previous year.
- Data Entry: Similar to the Actual Numbers Input Sheet, you’ll input last year’s data here for comparison purposes. This makes it easier to evaluate year-over-year growth or areas where improvement is needed.
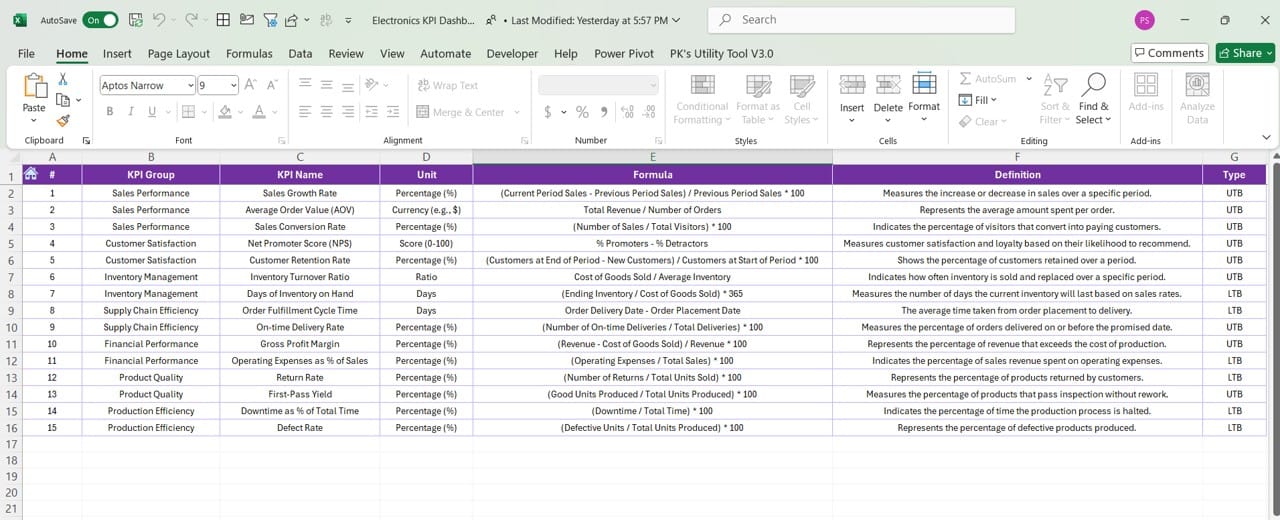
KPI Definition Sheet Tab
Click to buy Electronics KPI Dashboard in Excel
The KPI Definition Sheet provides a place to document each KPI.
- KPI Details: For each KPI, input the name, group, unit of measurement, formula, and a brief definition. Having this information readily available ensures clarity and consistency when analyzing KPIs across your organization.
Advantages of the Electronics KPI Dashboard
This Excel-based KPI dashboard provides numerous benefits for businesses in the electronics sector. Let’s dive into a few key advantages:
- User-Friendly Interface: The dashboard’s easy-to-navigate design allows even non-technical users to monitor and track KPIs effectively. With intuitive drop-down menus and visual cues, understanding your business performance becomes simpler and faster.
- Real-Time Data Insights: With the ability to update actual and target data, this dashboard provides real-time insights into your business performance. You can easily see how well you’re meeting your goals and quickly adjust strategies if necessary.
- Comprehensive Performance Tracking: By comparing both MTD and YTD metrics against targets and previous year’s performance, this dashboard gives you a 360-degree view of your electronics KPIs. The visual trend charts further enhance this by showing you long-term patterns at a glance.
Click to buy Electronics KPI Dashboard in Excel
Best Practices for Using the Electronics KPI Dashboard
To get the most out of your Electronics KPI Dashboard, follow these best practices:
- Keep Data Updated Regularly: The more frequently you update your dashboard, the more accurate your performance metrics will be. Make it a habit to input actual numbers at least once a week to keep an accurate pulse on your KPIs.
- Set Realistic Targets: When entering target values, ensure they are both challenging and achievable. Unrealistic targets can demotivate teams, while overly conservative targets may not drive improvement.
- Use Trend Charts for Long-Term Analysis: While monthly performance is important, the real value comes from analyzing trends over time. Make use of the trend charts to identify patterns that could indicate areas for improvement or opportunities for growth.
Opportunities for Improvement in the Electronics KPI Dashboard
Even though the Electronics KPI Dashboard is a powerful tool, there are always ways to improve its effectiveness. Here are a few suggestions:
- Automation Features: Consider adding automation features using Excel macros or Power BI integrations. This could streamline data input and automatically generate reports, saving you time and reducing errors.
- Custom KPI Groups: While the dashboard comes with pre-defined KPI groups, allowing more flexibility to customize KPI categories could improve its adaptability for diverse business needs.
- More Advanced Visualizations: Though the trend charts are useful, incorporating more advanced visualizations like heat maps or scatter plots could further enhance data analysis. This would provide more insights into relationships between KPIs.
Frequently Asked Questions (FAQs)
Q. What are an Electronics KPI Dashboard?
An Electronics KPI Dashboard is an Excel-based tool designed to help businesses track and analyze key performance indicators related to the electronics industry. It enables companies to monitor their performance against set targets and past performance.
Q. Can I customize the KPIs in the dashboard?
Yes, the dashboard is fully customizable. You can define your own KPIs, set specific targets, and even modify formulas according to your business requirements.
Q. How often should I update the KPI dashboard?
It’s best to update the dashboard weekly or at least monthly to ensure that the data remains accurate and reflective of your actual business performance.
Q. How can this dashboard help my electronics business?
By tracking key metrics in real-time, you can make informed decisions about production, sales, and customer service. It also helps you identify areas for improvement, thus optimizing overall business efficiency.
Conclusion
The Electronics KPI Dashboard in Excel is a powerful tool that offers a comprehensive view of business performance through key performance indicators. With its user-friendly design, real-time data tracking, and the ability to compare past and current performance, this dashboard is invaluable for making informed, strategic decisions. By following best practices and continuously improving the dashboard’s features, you’ll ensure that your electronics business stays ahead of the competition.
So, whether you’re monitoring sales performance, production efficiency, or customer satisfaction, this KPI dashboard is an excellent resource for achieving your business goals.
Visit our YouTube channel to learn step-by-step video tutorials
Click to buy Electronics KPI Dashboard in Excel
View this post on Instagram
Click to buy Electronics KPI Dashboard in Excel