
In today’s fast-paced banking world, keeping track of performance is essential to staying competitive. Banking KPI Dashboard in Excel need to measure various aspects of their operations, and this is where Key Performance Indicators (KPIs) come into play. A Banking KPI Dashboard is an effective tool that allows you to monitor and analyze these metrics, helping you make informed decisions quickly. In this guide, we will walk you through everything you need to know about creating and using a Banking KPI Dashboard in Excel, which is a ready-to-use template designed specifically for banking KPIs.
Click to buy Banking KPI Dashboard in Excel
What Is Banking KPIs?
Key Performance Indicators (KPIs) are measurable values that help banks assess how well they are achieving their business objectives. KPIs can include things like profitability, loan default rates, customer satisfaction, and much more. Having a KPI dashboard consolidates these metrics into one place, making it easier for managers and decision-makers to view and understand their performance at a glance.
In this article, we introduce a ready-to-use Banking KPI Dashboard in Excel that tracks various banking KPIs across Monthly-To-Date (MTD) and Year-To-Date (YTD) data, providing a real-time view of a bank’s performance.
Click to buy Banking KPI Dashboard in Excel
Key Features of the Banking KPI Dashboard in Excel
Our Banking KPI Dashboard consists of 7 key worksheets, each designed to serve a specific purpose in managing your banking KPIs. Let’s take a closer look at these features:
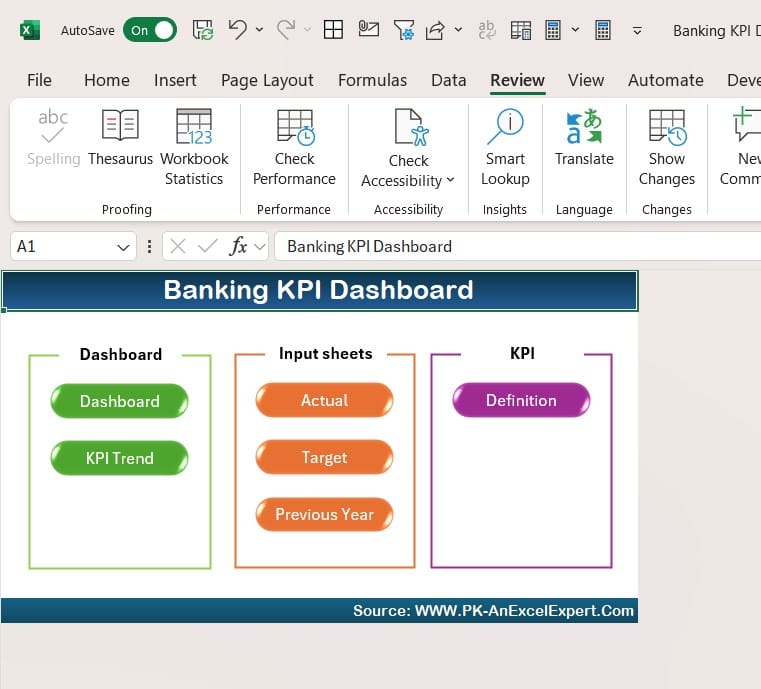
Home Sheet:
Click to buy Banking KPI Dashboard in Excel
The Home Sheet acts as the control center for the dashboard. It includes 6 clickable buttons that allow you to jump to different parts of the dashboard, such as the main KPI dashboard and the data input sheets. This sheet makes navigating the dashboard quick and simple.
- Why It’s Useful: It helps users move easily between different sections of the dashboard without getting lost.
- Best Practice: Keep the buttons labeled clearly so anyone using the dashboard knows exactly where they will go.
Dashboard Sheet Tab:
Click to buy Banking KPI Dashboard in Excel
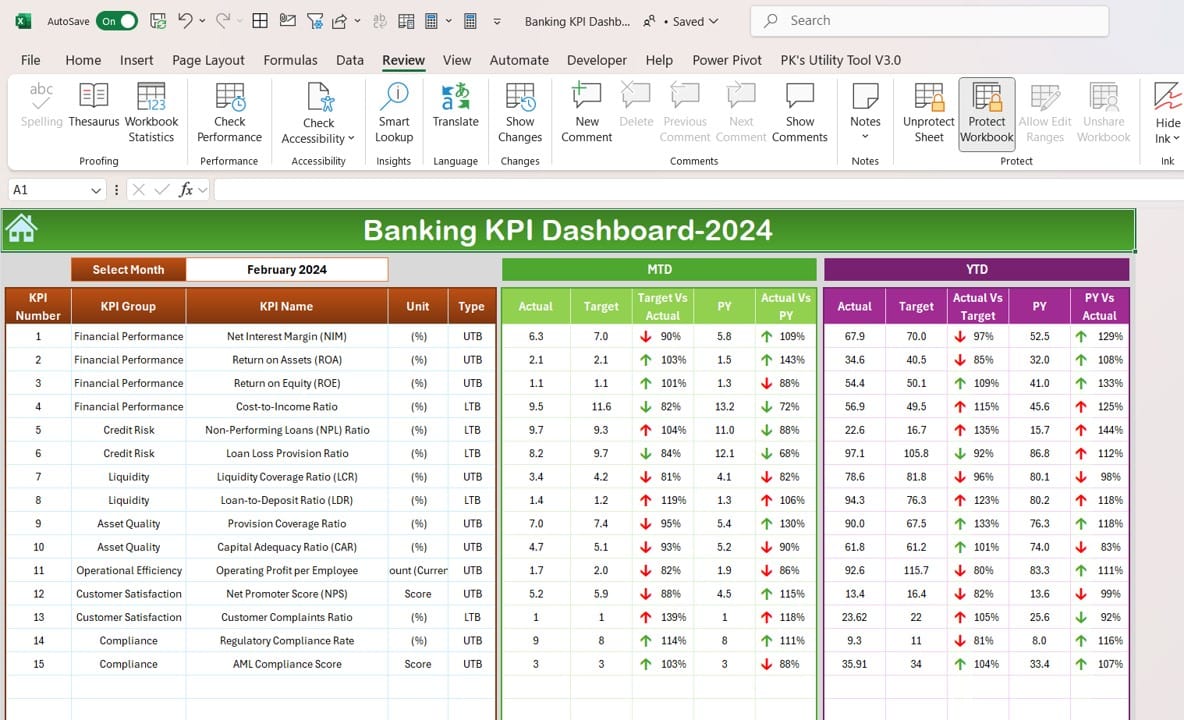
The Dashboard Sheet Tab is the most important part of the Banking KPI Dashboard. Here, you can track all the essential KPIs in real-time. You can select the month you want to view using a drop-down menu located at range D3. When you choose a month, all the data on the dashboard will automatically update to show Monthly-To-Date (MTD) and Year-To-Date (YTD) performance metrics.
- The Dashboard Sheet includes: MTD Actual, Target, and Previous Year (PY) data.
Comparisons between Target vs. Actual and PY vs. Actual.
YTD Actual, Target, and PY data with similar comparisons.
To make it easier to see trends, the dashboard uses conditional formatting with up and down arrows to show whether performance is improving or declining.
- Why It’s Useful: It gives a snapshot of how well the bank is performing across all its KPIs.
- Best Practice: Make sure data is updated regularly to get the most accurate view.
KPI Trend Sheet Tab:
Click to buy Banking KPI Dashboard in Excel
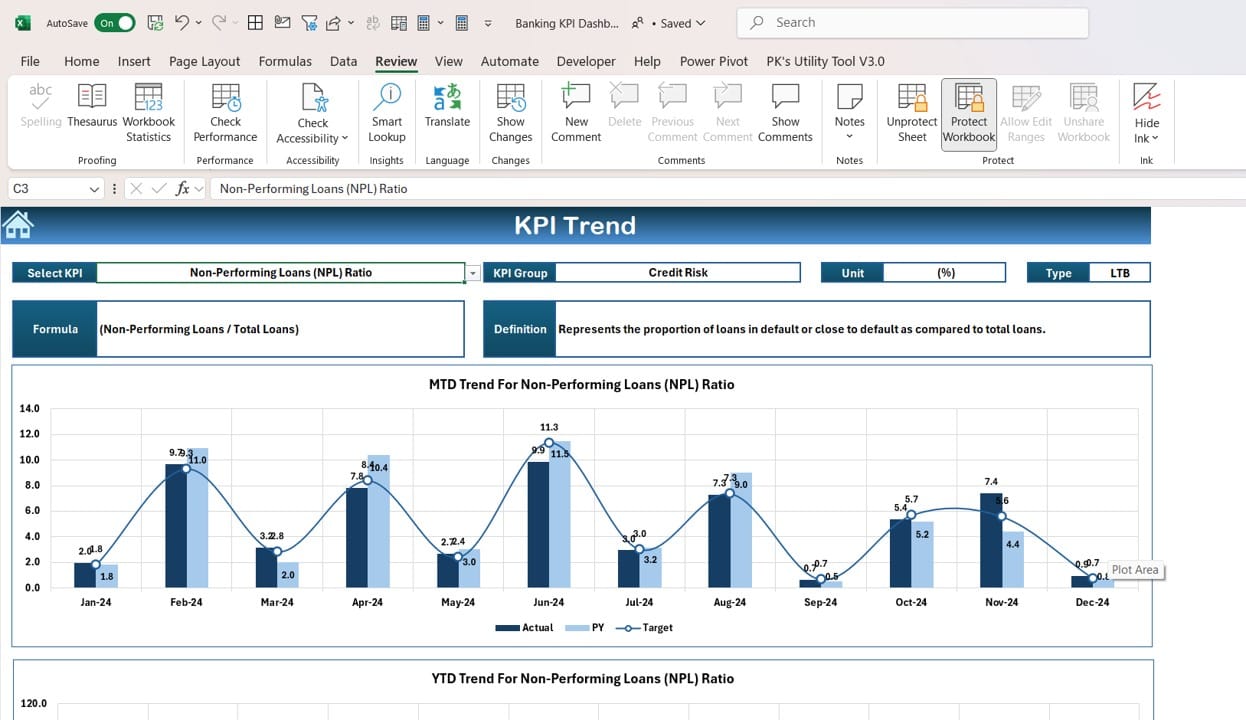
The KPI Trend Sheet Tab is where you can select a specific KPI from a drop-down list (available in range C3) and analyze it in detail. For each KPI, this sheet displays:
- KPI Group: What category the KPI belongs to (e.g., customer satisfaction, financial health).
- Unit of KPI: The unit of measurement (e.g., percentage, dollars).
- KPI Type: Whether a lower or higher number is better.
- KPI Formula: How the KPI is calculated.
- KPI Definition: A brief explanation of the KPI and why it matters.
This sheet also shows MTD and YTD trend charts for Actual, Target, and Previous Year values, making it easier to see how the KPI is performing over time.
- Why It’s Useful: It provides a detailed breakdown of each KPI, making it easy to identify trends.
- Best Practice: Keep definitions and formulas updated so everyone understands what each KPI measures.
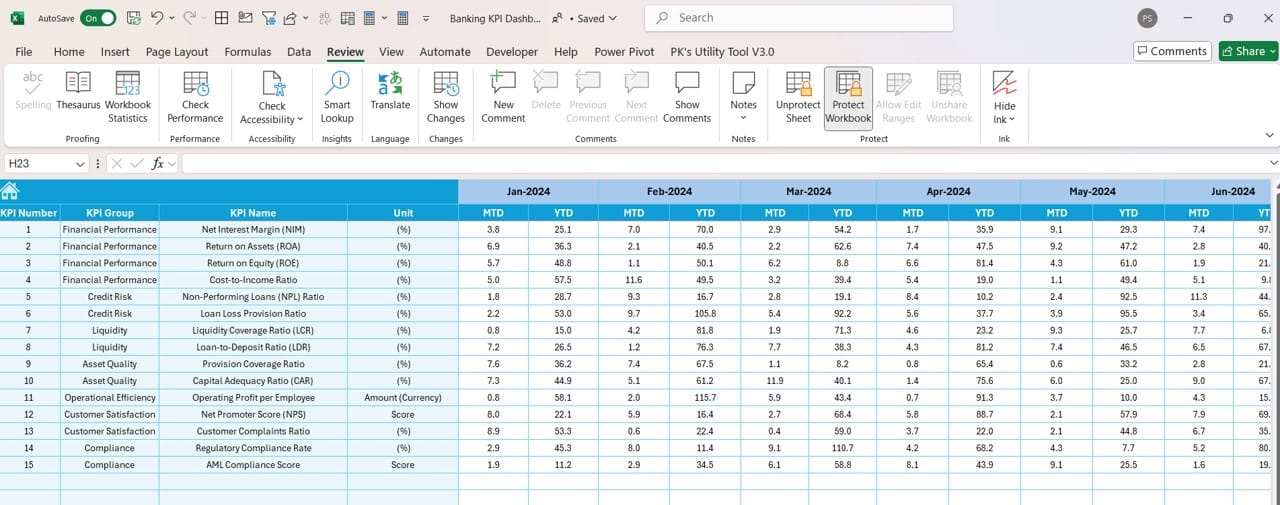
Actual Numbers Input Sheet:
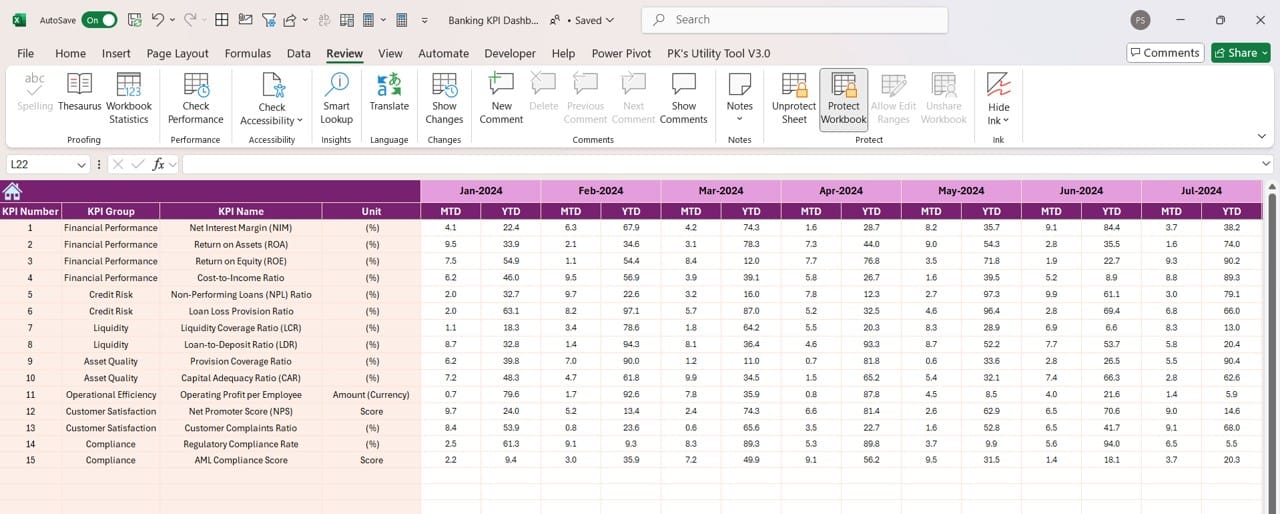
The Actual Numbers Input Sheet is where you enter the actual performance data for your KPIs. You can input both Monthly-To-Date (MTD) and Year-To-Date (YTD) values. The sheet allows you to select the month by entering the first month of the year in range E1. This makes it easy to update performance numbers each month.
- Why It’s Useful: It ensures that the dashboard reflects the most current performance data.
- Best Practice: Double-check all numbers before inputting them to avoid mistakes.
Target Sheet Tab:
Click to buy Banking KPI Dashboard in Excel
The Target Sheet Tab is where you set the target numbers for each KPI. You can input targets for both MTD and YTD values. By setting targets, you create benchmarks that allow you to see how actual performance compares to the goals you’ve set for your bank.
- Why It’s Useful: Setting clear targets helps you monitor how well your bank is doing in achieving its goals.
- Best Practice: Review targets periodically to ensure they are still aligned with your bank’s overall strategy.
Previous Year Numbers Sheet Tab:
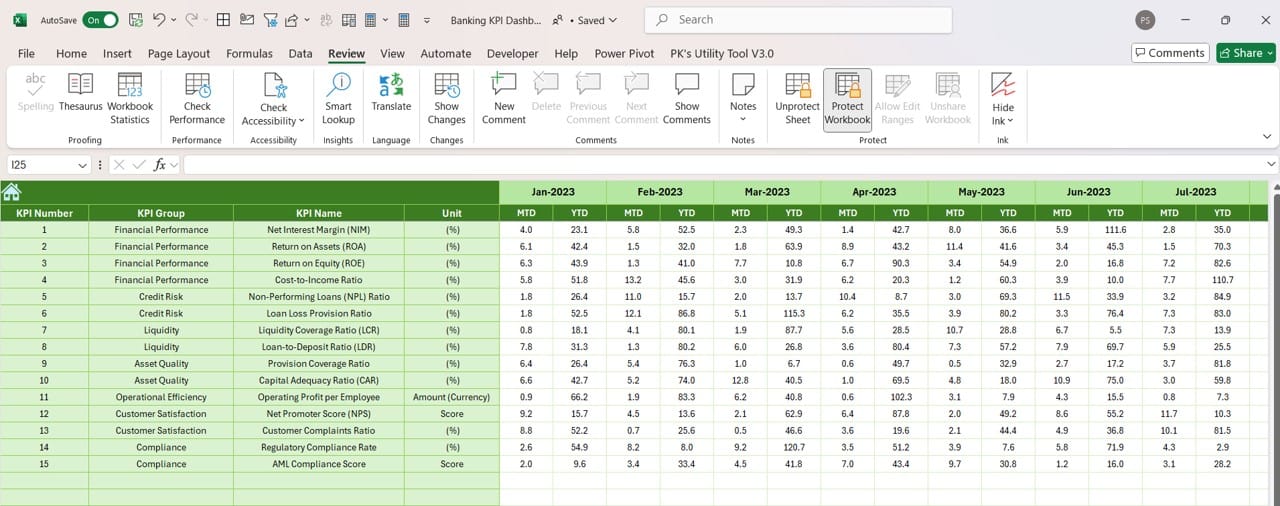
Click to buy Banking KPI Dashboard in Excel
The Previous Year Numbers Sheet Tab is where you enter the numbers for the same KPIs from the previous year. This data is important for making year-over-year comparisons, helping you to see if your bank’s performance is improving or declining.
- Why It’s Useful: Comparing this year’s performance to last year’s gives valuable context to your KPI analysis.
- Best Practice: Make sure to input complete data for the previous year to get meaningful comparisons.
KPI Definition Sheet Tab:
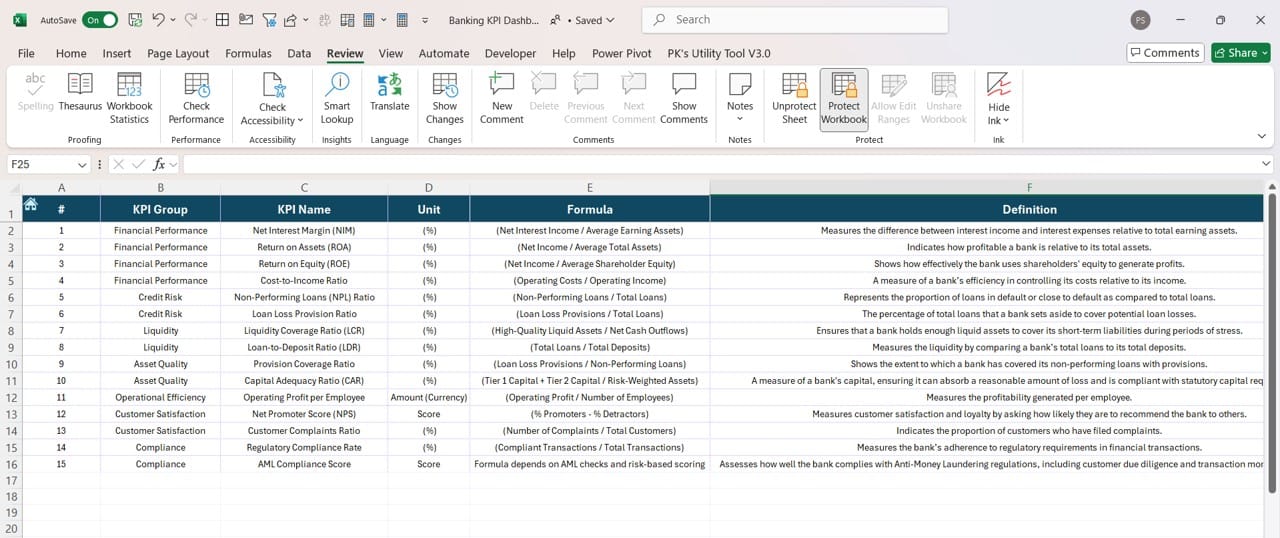
Click to buy Banking KPI Dashboard in Excel
In the KPI Definition Sheet Tab, you can define each KPI, including the KPI name, KPI group, unit, formula, and definition. This ensures that everyone who uses the dashboard understands what each KPI is tracking and how it’s calculated.
- Why It’s Useful: Provides clarity on what each KPI measures and how it contributes to overall performance.
- Best Practice: Regularly update this sheet to keep KPI definitions accurate and relevant.
Advantages of a Banking KPI Dashboard in Excel
Using a Banking KPI Dashboard in Excel comes with numerous advantages. Let’s go over some of the key benefits:
Centralized Performance Data
One of the biggest advantages of this dashboard is that it brings all your KPI data together in one place. Instead of managing multiple spreadsheets, you have a single view of your bank’s performance metrics.
- Benefit: Saves time by eliminating the need to gather data from multiple sources.
- Benefit: Provides a clear and easy-to-read view of overall performance.
Real-Time Performance Insights
With real-time updates, the dashboard gives you up-to-date information on your bank’s performance. By comparing actual performance to targets and previous year data, you can quickly identify areas that need attention.
- Benefit: Helps make informed decisions quickly.
- Benefit: Allows for timely adjustments to meet performance goals.
Click to buy Banking KPI Dashboard in Excel
Visual Indicators for Quick Analysis
The dashboard includes visual indicators like charts and conditional formatting that help you spot trends and variances in key metrics. Whether you’re looking at upward or downward arrows, it’s easy to see how your KPIs are performing.
- Benefit: Visuals make complex data easier to understand.
- Benefit: Enables faster decision-making by providing clear insights.
Best Practices for Using a Banking KPI Dashboard
To get the most out of your Banking KPI Dashboard, follow these best practices:
- Regular Data Updates: Ensure that you update the data in your dashboard consistently. Monthly updates are essential for keeping the information relevant and useful.
- Tip: Schedule a regular time each month for data entry and validation.
Align KPIs with Business Goals Your KPIs should align with the overall objectives of your bank. This ensures that the metrics you’re tracking are meaningful and directly tied to your bank’s success.
- Tip: Review your KPIs quarterly to ensure they remain aligned with your goals.
- Foster a Data-Driven Culture: Encourage all employees to use the dashboard to monitor performance. This will ensure that your team is making data-driven decisions that improve overall banking operations.
- Tip: Provide training on how to interpret and act on the KPI data.
Opportunities for Improvement in the Banking KPI Dashboard
While the Banking KPI Dashboard in Excel is a highly effective tool, there are always opportunities for improvement:
- Automating Data Entry: Currently, data entry is done manually, which can be time-consuming and prone to errors. Automating this process by integrating it with other banking software would save time and ensure more accurate data.
- Customizable Layouts: Although the dashboard is useful, offering more options for customization would allow different departments within the bank to tailor the dashboard to their specific needs.
- Enhanced Visuals: While the dashboard includes basic charts, adding more sophisticated visuals like interactive graphs or heat maps would make the data even more user-friendly and insightful.
Click to buy Banking KPI Dashboard in Excel
Conclusion
A Banking KPI Dashboard in Excel is an essential tool for tracking, analyzing, and improving your bank’s performance. By consolidating all your KPI data in one place and providing real-time updates, the dashboard helps managers make better, faster decisions. By regularly updating the data, aligning KPIs with business goals, and fostering a data-driven culture, you
Visit our YouTube channel to learn step-by-step video tutorials
Click to buy Banking KPI Dashboard in Excel


