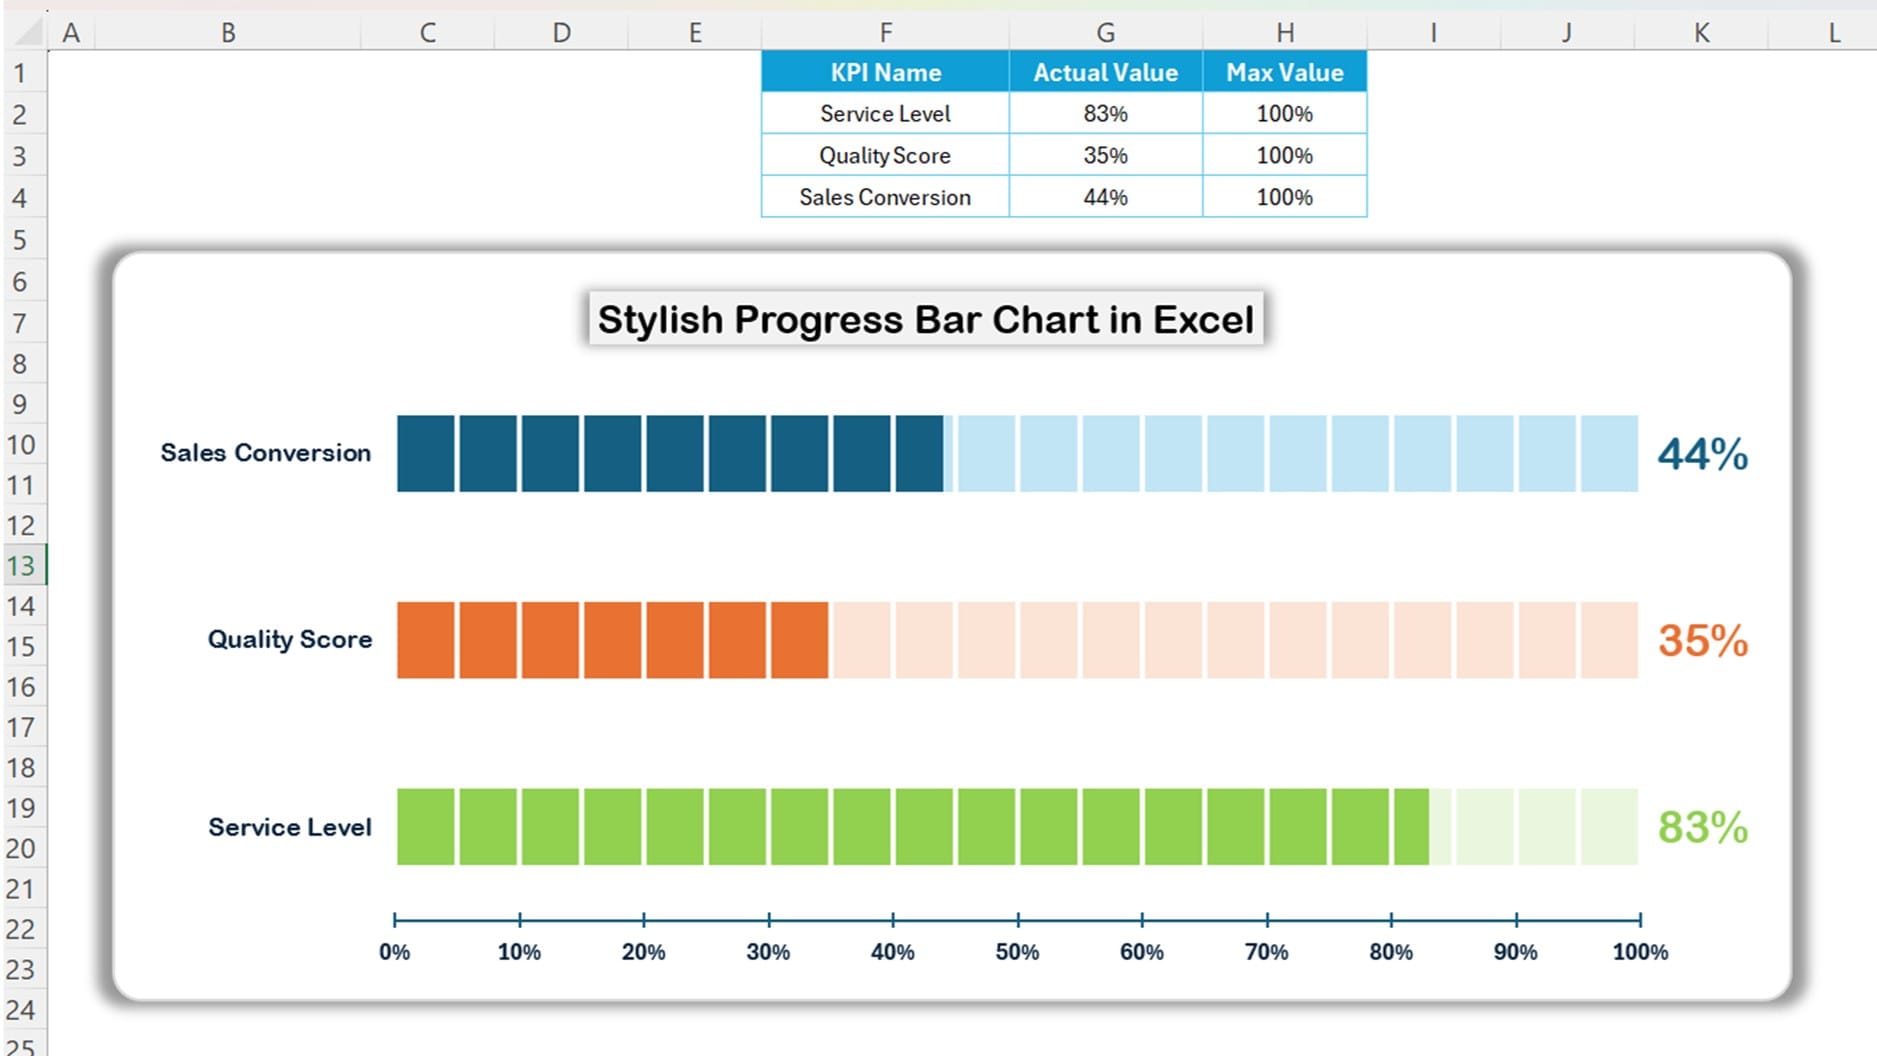
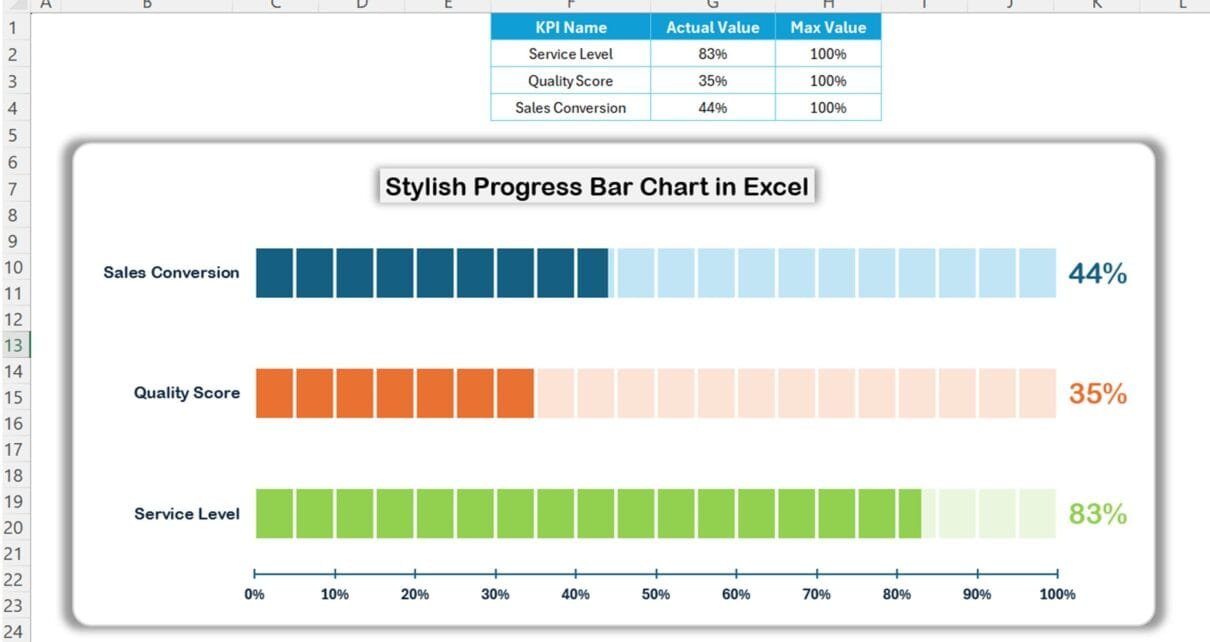
This is a ready to use Stylish Progress Bar Chart in Excel template. You can just change the Actual KPI data and KPI name, chart will be created automatically. It is perfect for visualizing key metrics like service level, quality score, and sales conversion or any other metric for 100%. This template helps you present data in a professional and eye-catching way. It is ideal for business reports, presentations, and data-driven decision-making.
Key Features:
Below are the key features of Stylish Progress Bar chart in Excel-

- Dynamic KPI Tracking: Easily monitor metrics such as service level, quality score, and sales conversion with visual clarity.
- Fully Customizable: Adjust colors, bar shapes, and formatting to match your brand or presentation style.
- Simple Setup: Ready-to-use format with clear instructions for quick implementation.
- Interactive Design: Includes interactive bars that automatically update with your data changes.
- Professional Appeal: A clean, stylish look that enhances data presentations and improves readability.
- Compatible with Excel: Works seamlessly with Excel’s built-in tools for easy integration.


