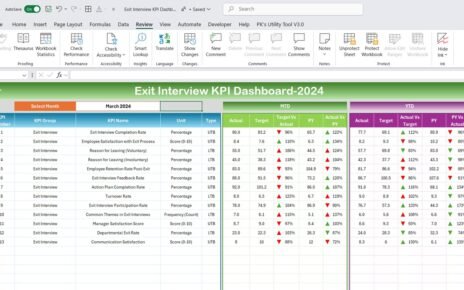
In today’s fast-paced business environment, data-driven decision-making is essential to improving organizational performance. One of the best ways to monitor and evaluate your human resources’ effectiveness is by using an HR KPI Dashboard. This powerful tool helps businesses track key performance indicators (KPIs) that are crucial to measuring the success of HR activities.
This article will provide you with a detailed understanding of what an HR KPI Dashboard is, how to create one, the KPIs to include, and best practices for effective use. Additionally, we will walk through a sample HR KPI Dashboard structure and its key features.
What is an HR KPI Dashboard?
An HR KPI Dashboard is a data visualization tool that provides HR managers and business leaders with a comprehensive view of the organization’s HR performance. It consolidates various HR metrics into an easily digestible format, making it easier to analyze trends, track employee performance, and measure HR outcomes in real time.
The dashboard typically includes KPIs such as employee retention, absenteeism, employee satisfaction, and recruitment efficiency. It allows HR professionals to assess how well HR initiatives are aligning with organizational goals and make informed decisions to improve performance.
Key Features of an HR KPI Dashboard
Building a successful HR KPI Dashboard involves incorporating several key features that allow users to access, track, and interpret HR data effectively. Below is an overview of the structure and features of a typical HR KPI Dashboard, inspired by the one you’ve developed for construction KPIs.
Home Sheet
The Home Sheet serves as the index page of the dashboard. It provides an overview of the entire dashboard and includes buttons to jump to the respective sheets within the dashboard for quick access.

Dashboard Sheet Tab
The Dashboard Sheet is the main page where all HR KPIs are displayed. It allows HR professionals to view the Month-to-Date (MTD) and Year-to-Date (YTD) figures for each KPI. Users can select the month from a drop-down list, and the entire dashboard will update accordingly. This page includes:

KPI Trend Sheet Tab
The KPI Trend Sheet allows HR professionals to monitor KPI trends over time. Users can select a KPI from a drop-down menu, and the dashboard will display the relevant trend data, unit of measurement, type of KPI (e.g., “Lower is Better” or “Upper is Better”), and formula for calculation.

Actual Numbers Sheet Tab
This sheet is used to enter the actual figures for each KPI, whether for MTD or YTD. Users can update the month, and the figures will automatically populate across the dashboard. The flexibility of this sheet allows for accurate data entry and real-time updates.

Target Sheet Tab
In this sheet, HR professionals input the target values for each KPI for the given month. The targets are then compared to actual performance in the Dashboard Sheet.
Previous Year Numbers Sheet Tab
Here, HR managers enter the historical performance data from the previous year. This allows for performance comparisons between the current year and the previous year to assess improvements or declines.

KPI Definitions Sheet Tab
The KPI Definitions Sheet serves as a reference guide. It includes detailed definitions, formulas, and explanations for each KPI included in the dashboard. This helps HR professionals and business leaders understand what each KPI measures and how it is calculated.
Best Practices for Building an Effective HR KPI Dashboard
Creating an HR KPI Dashboard is not just about tracking numbers; it’s about making informed decisions that drive organizational success. Below are some best practices for building an effective HR KPI Dashboard:
- Define Clear Objectives
Understand the purpose of your HR KPIs. Whether you’re measuring employee performance, recruiting success, or training effectiveness, align your dashboard with the strategic goals of the organization.
- Keep It Simple
Avoid clutter by only including KPIs that are relevant to your objectives. Focus on the most important metrics that will provide actionable insights.
- Ensure Data Accuracy
Accurate data is the foundation of any successful dashboard. Ensure that the data entered is correct and up-to-date, especially when it comes to actual numbers, targets, and previous year comparisons.
- Use Conditional Formatting
Use color codes, arrows, and charts to visually represent performance trends. This will make it easier to spot areas that require attention at a glance.
- Update Regularly
HR KPIs should be updated frequently to reflect current performance. Establish a regular schedule for updating the dashboard to ensure the information is always relevant.
Opportunities for Improvement in HR KPI Dashboards
While HR KPI Dashboards are powerful tools, there is always room for improvement. Some opportunities for optimization include:
- Incorporating Predictive Analytics: Use historical data to predict future trends and potential issues, giving HR professionals a proactive approach to problem-solving.
- Mobile Access: Ensure that your HR KPI Dashboard is mobile-friendly, allowing HR managers and executives to access key metrics from anywhere.
- Automating Data Entry: Integrate the dashboard with other HR systems to automate the data input process and reduce the chances of manual errors.
Conclusion
An HR KPI Dashboard is an indispensable tool for HR professionals seeking to improve workforce performance and align HR activities with organizational goals. By carefully selecting the right KPIs, designing a user-friendly dashboard, and adhering to best practices, businesses can create a powerful resource for monitoring and improving HR metrics.
Visit our YouTube channel to learn step-by-step video tutorials


