The IT KPI Dashboard in Power BI is a professional, ready-to-use tool designed to track and visualize your IT team’s key performance metrics. Leveraging the powerful capabilities of Power BI and structured Excel data inputs, this dashboard provides actionable insights into Month-to-Date (MTD) and Year-to-Date (YTD) performance trends, helping you meet organizational goals efficiently IT KPI Dashboard.
Key Features
Summary Page
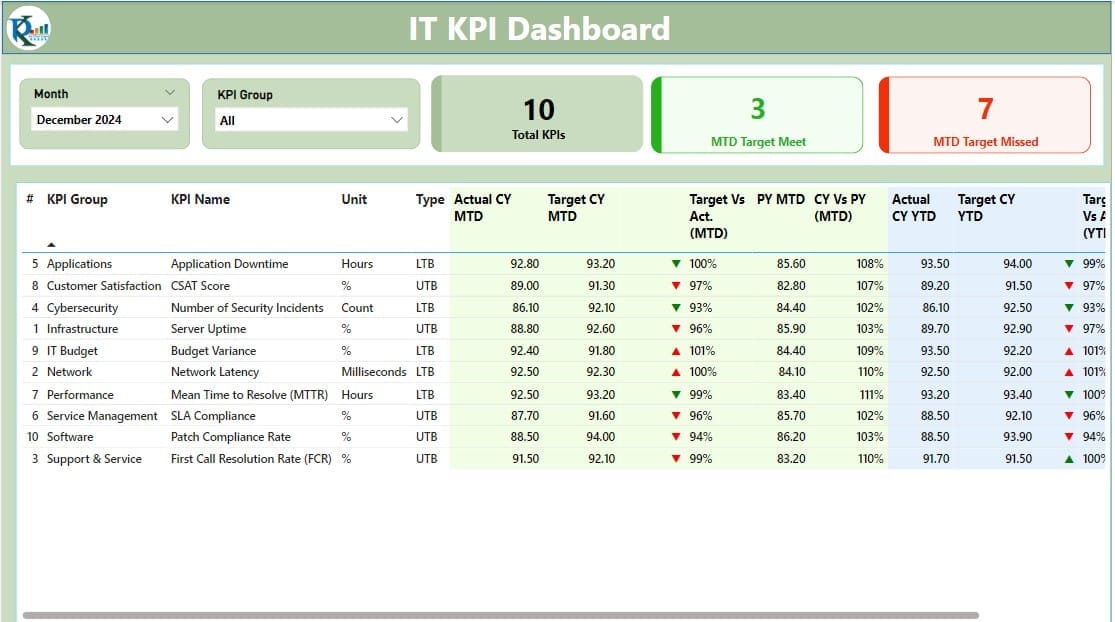
- Displays a comprehensive overview of KPIs with slicers for filtering by Month and KPI Group.
- Includes cards showcasing Total KPIs Count, MTD Target Met, and MTD Target Missed.
- Provides a detailed table featuring metrics such as KPI Type, Unit, Actual vs. Target values, and comparative analysis between Current Year and Previous Year performance.
KPI Trend Page
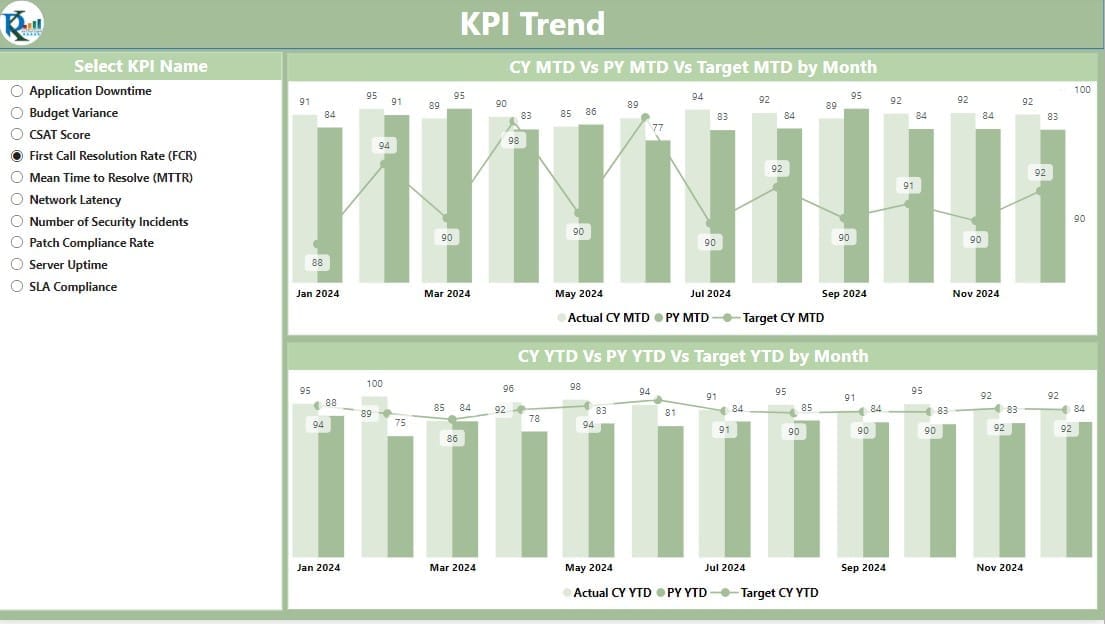
- Features combo charts for visualizing Actual Numbers and Targets for MTD and YTD performance.
- Allows easy filtering through a slicer to focus on specific KPIs.
KPI Definition Page
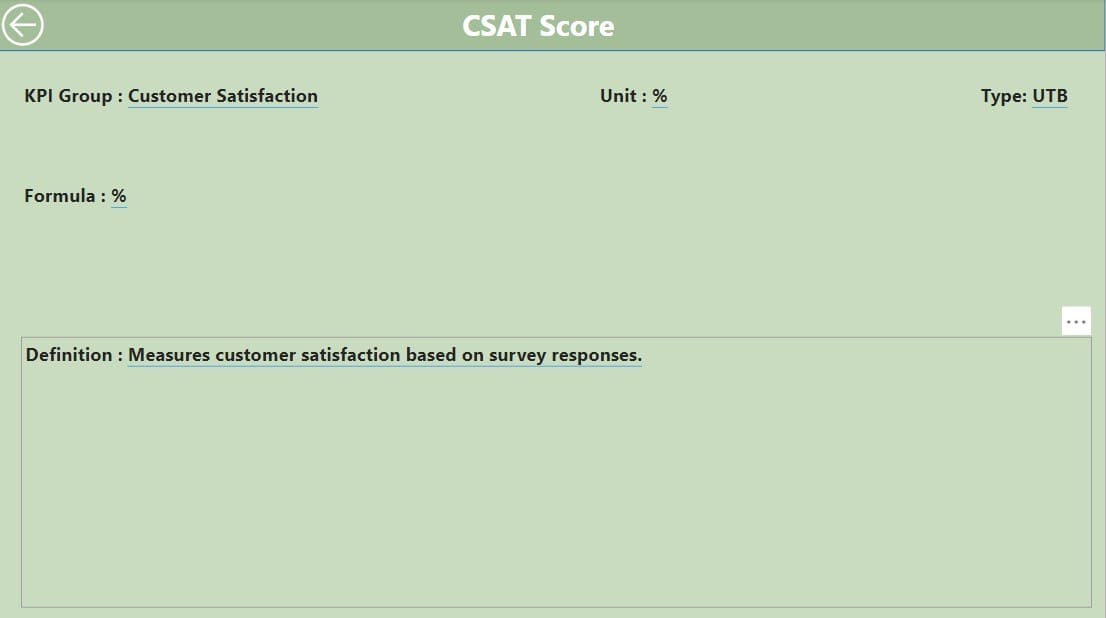
- A hidden drill-through page for accessing KPI formulas and definitions, offering clarity on metric calculations.
- Includes a convenient back button for seamless navigation.
Excel-Based Data Source
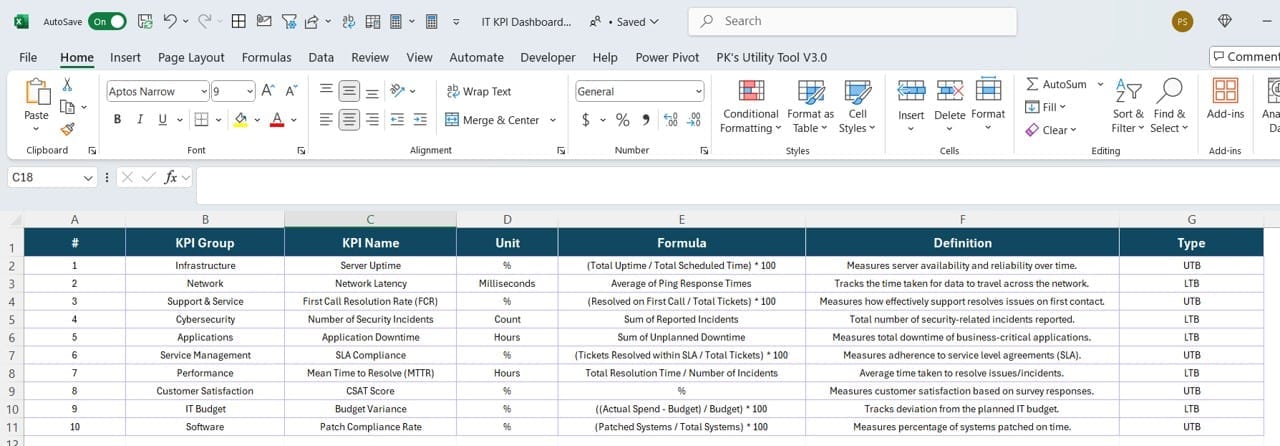
- Organized input sheets for Actual and Target values, ensuring easy data updates.
- Includes a KPI Definition sheet to customize metrics, formulas, and types (LTB/UTB).
Read the detailed blog post