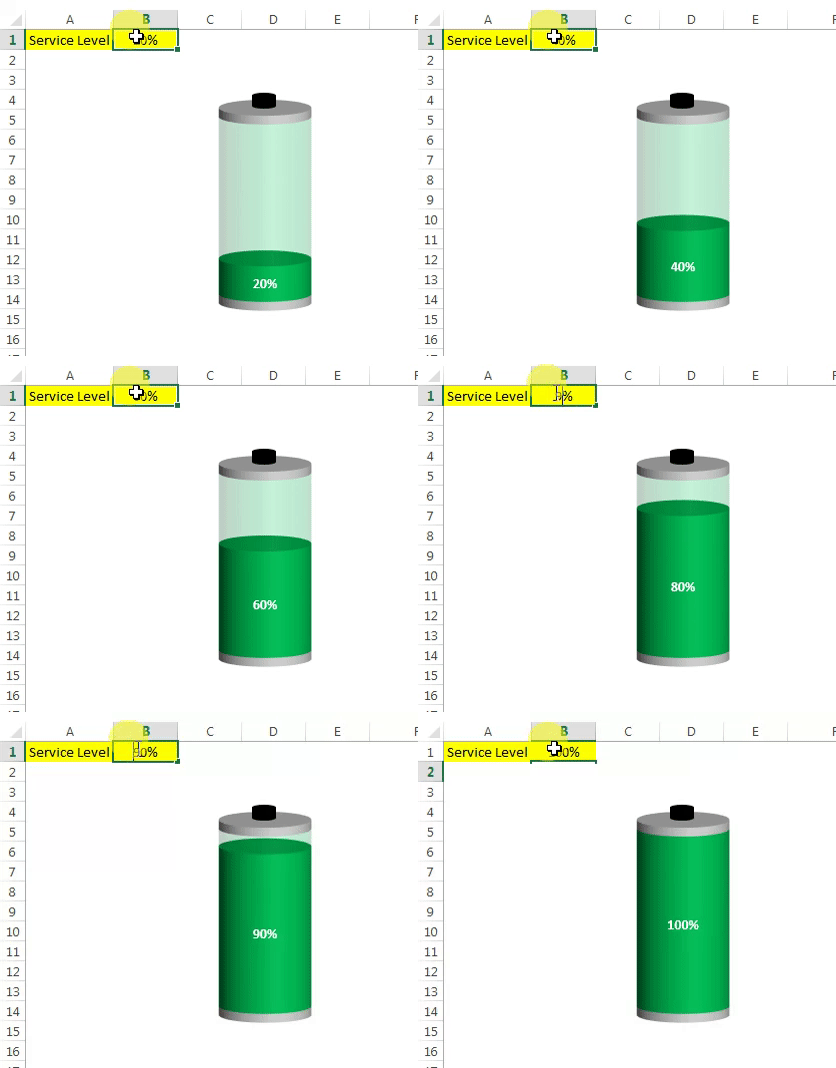
The Battery Chart Excel file is an innovative tool designed to visually represent Key Performance Indicators (KPIs) in a dynamic and engaging battery-style format. Ideal for monitoring and presenting process service levels and other metrics, this chart offers a clear, graphical representation of performance data, making it easier to track progress and identify areas for improvement.
Key Features of the Battery Chart
Customizable Metrics Display:

- Input your specific KPI metrics, such as service levels, and visualize them as a battery’s charge level to depict performance intuitively.
Interactive 3D Visualization:
- Utilize 3D stacked column charts to transform standard data into a 3-dimensional battery representation, enhancing both the visual appeal and readability of your data.
Easy Configuration Steps:
- Follow a simple, step-by-step guide to set up your battery chart, including adjusting 3D rotations, customizing color fills, and configuring data series for a tailored display.
Enhanced Data Interaction:
- Incorporate features like data labels with customizable fonts and colors, and adjust the transparency and gap width for a clearer differentiation between chart components.


