Welcome to a revolutionary way of handling attendance records! Whether you manage a small team or oversee a large workforce,
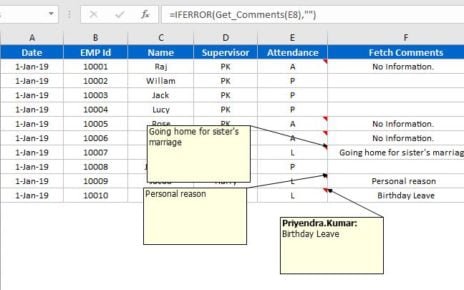
In this article, you will learn how to create a UDF to Fetch Comment Text in Excel Cell VBA to get
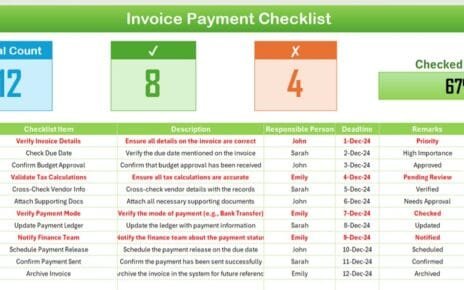
Managing invoices doesn’t have to be complicated. With the right tools and structure, it can be seamless and stress-free. That’s