When managing complex projects or infrastructure, having a precise and well-structured way to track performance is crucial. The Infrastructure KPI Dashboard in Power BI serves as a ready-to-use tool, capturing essential data via Excel and presenting it in an insightful manner within Power BI. This dashboard not only simplifies data visualization but also enhances decision-making processes with real-time insights.
Key Features of the Infrastructure KPI Dashboard
The Infrastructure KPI Dashboard is designed to cater to the needs of businesses that require meticulous tracking of infrastructure-related KPIs. Here’s a breakdown of its core features:
Summary Page: The Heart of the Dashboard
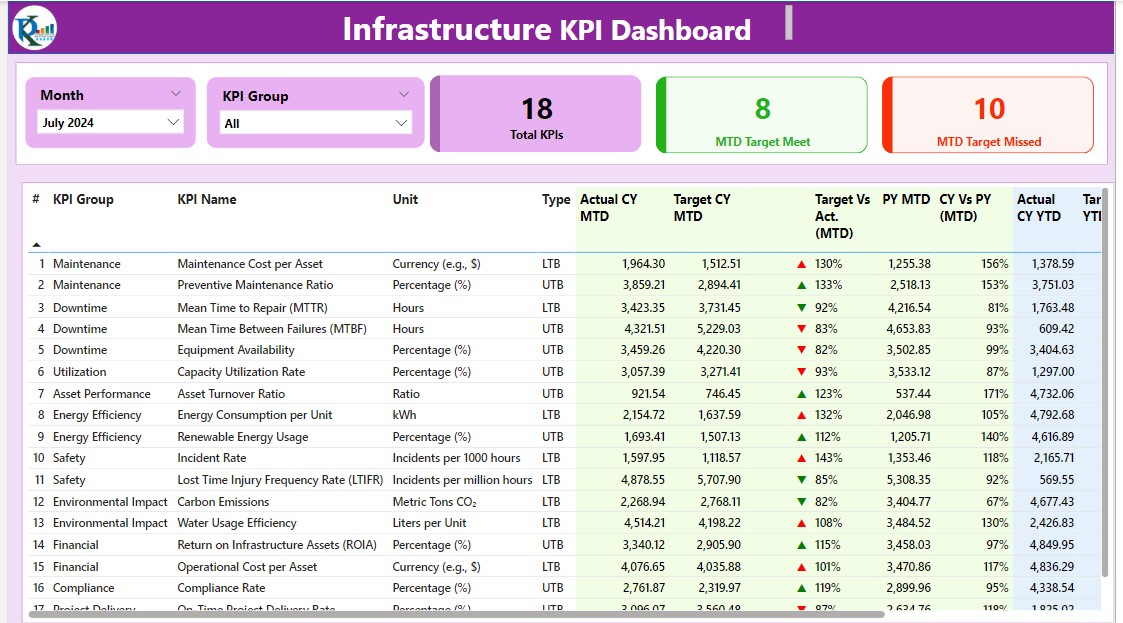
- Slicers for Month and KPI Group: Allows users to filter data based on the month and the category of the KPI.
- KPI Status Cards: Displays counts of total KPIs, those meeting the month-to-date (MTD) target, and those missing the MTD target.
- Detailed KPI Table: Provides comprehensive details including:
- KPI Number: The sequence number of the KPI.
- KPI Group and Name: Category and specific name of the KPI.
- Unit and Type: Measurement units and the type (Lower the Better or Upper the Better).
- Actual vs. Target Performance: Current year’s actual performance against the target, shown both for MTD and year-to-date (YTD), with visual indicators (▼, ▲ in red and green).
- Year-over-Year Comparison: Shows percentage comparison of current MTD and YTD performance against the previous year.
KPI Trend Page: Visual Analysis
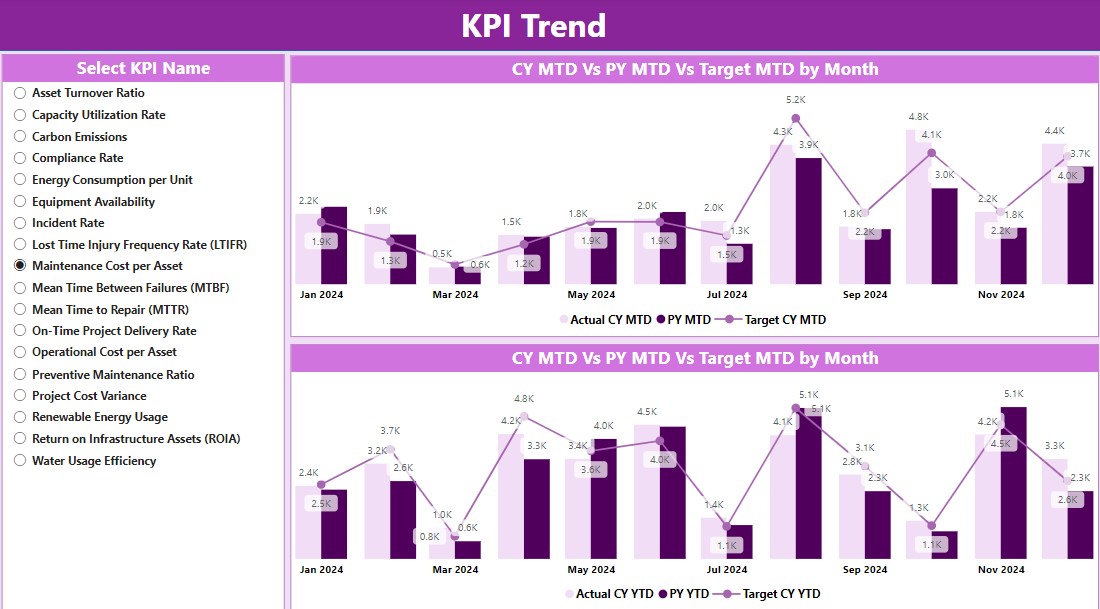
- Combo Charts: Visualize the actual numbers for the current year, previous year, and targets for both MTD and YTD.
- KPI Selector Slicer: Enables selection of specific KPIs to display trends over selected periods.
KPI Definition Page: Dive Deeper
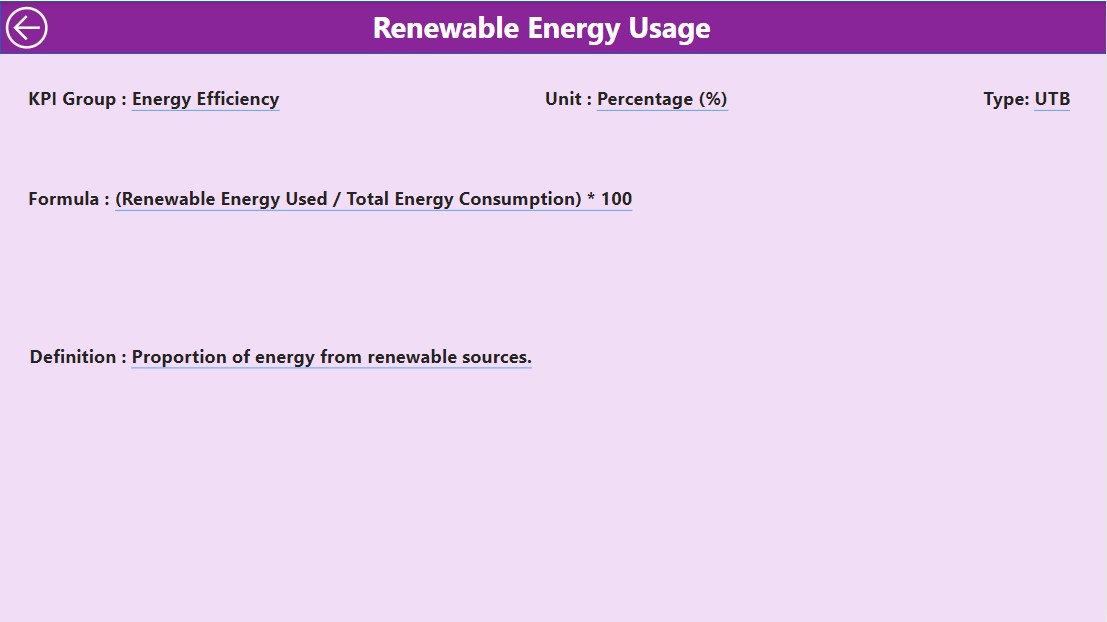
Drill-through Capability:
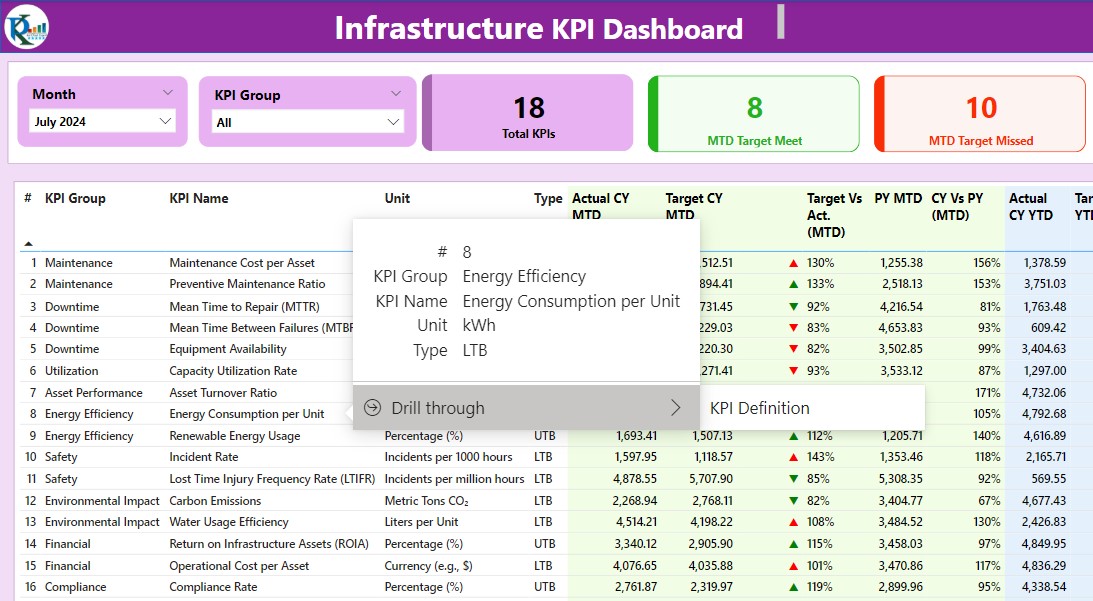
- Though hidden, this page allows a deeper look into the formula and definition of each KPI via drill-through from the summary page.
Advantages of Using the Infrastructure KPI Dashboard in Power BI
Implementing the Infrastructure KPI Dashboard in Power BI offers several benefits:
- Enhanced Clarity: Breaks down complex data into understandable metrics.
- Improved Decision Making: Real-time data facilitates quick and informed decisions.
- Customizable Views: Slicers and drill-through features allow for customized data exploration.
- Efficient Performance Tracking: Provides a clear view of targets versus actual performance and year-over-year trends.
Best Practices for Maintaining an Infrastructure KPI Dashboard
To maximize the effectiveness of your Infrastructure KPI Dashboard, consider these best practices:
- Regular Data Updates: Ensure the data fed into the dashboard is current and accurate.
- Clear KPI Definitions: Maintain detailed descriptions and formulas to ensure consistency in measurement.
- User Training: Train stakeholders on how to interpret dashboard data and utilize features effectively.
- Dashboard Reviews: Periodically review the dashboard setup to incorporate new KPIs or adjust existing ones based on evolving business needs.
Conclusion
The Infrastructure KPI Dashboard in Power BI is an invaluable tool for any organization that requires detailed and dynamic monitoring of its infrastructure-related KPIs. By integrating data from Excel and utilizing Power BI’s robust visualization capabilities, this dashboard ensures that all levels of management remain well-informed and prepared for strategic decision-making.
Frequently Asked Questions with Answers
Q. What is a KPI Dashboard?
A KPI Dashboard is a visual representation tool that displays key performance indicators (KPIs) to help users monitor and analyze business metrics effectively.
Q. Can I customize the Infrastructure KPI Dashboard?
Yes, the dashboard is highly customizable. Users can modify slicers, add new KPIs, and adjust visual elements to meet specific monitoring needs.
Q. How do I update data in the Infrastructure KPI Dashboard?
Data updates are handled through the designated Excel file. Users need to input actual and target numbers for each KPI in the specified worksheets.
Visit our YouTube channel to learn step-by-step video tutorials
View this post on Instagram