The Textile Industry KPI Dashboard in Power BI is a sophisticated tool designed to streamline KPI management and visualization for textile businesses. This dashboard, fully integrated with Power BI, offers a detailed and interactive analysis platform directly from your Excel data, allowing for immediate and actionable insights Textile Industry KPI Dashboard.
Key Features of the Textile Industry KPI Dashboard:
Summary Page:
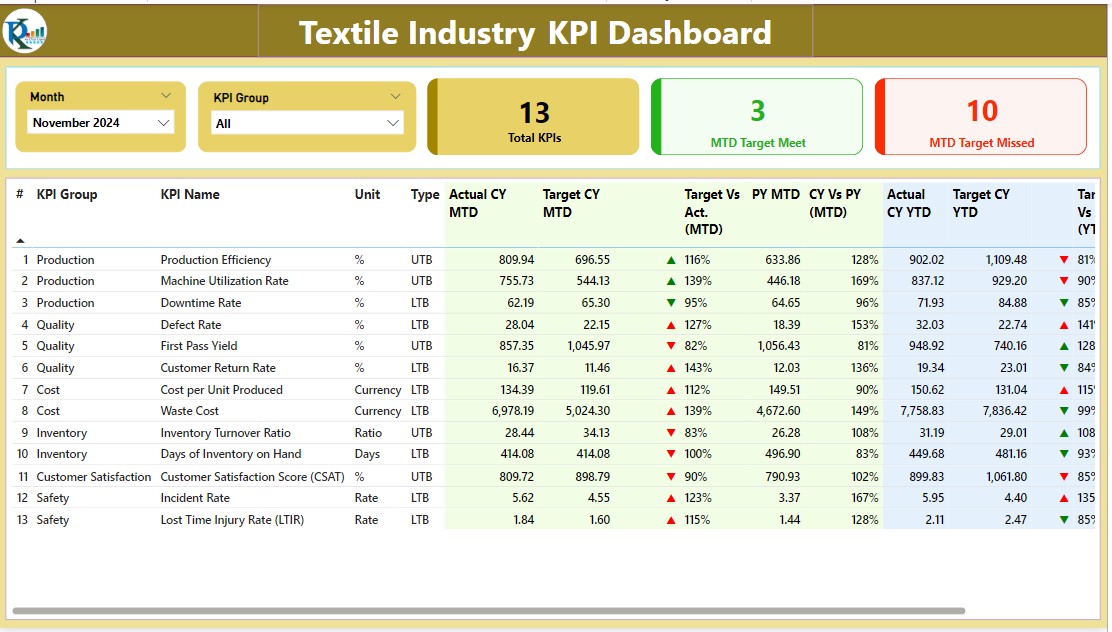
- Interactive Filters: Includes slicers for Month and KPI Group for dynamic viewing.
- Performance Cards: Display key metrics like Total KPIs, MTD Target Met, and MTD Target Missed.
- Detailed KPI Table: Provides comprehensive data on each KPI, including Number, Group, Name, Unit, Type, current and previous MTD/YTD performance, and a visual status indicator using intuitive icons.
KPI Trend Page:
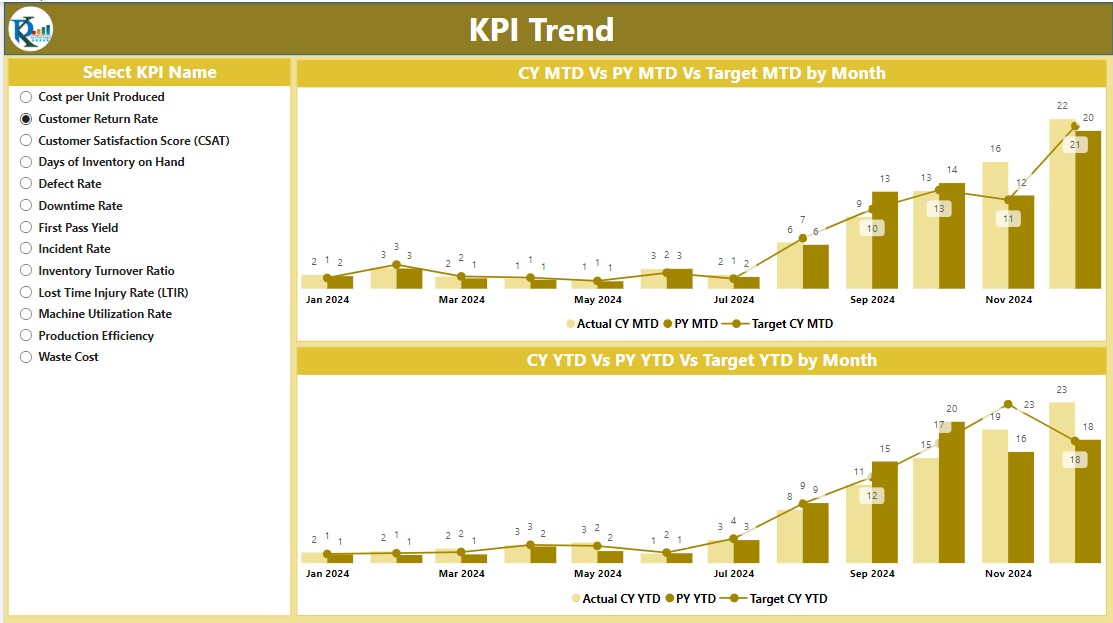
- Dual Combo Charts: Visualize the Actual numbers, Targets, and Previous Year’s data for both MTD and YTD, aiding in trend analysis and performance tracking.
- KPI Selector Slicer: Allows for selective analysis, making it easier to focus on specific KPIs.
KPI Definition Page:
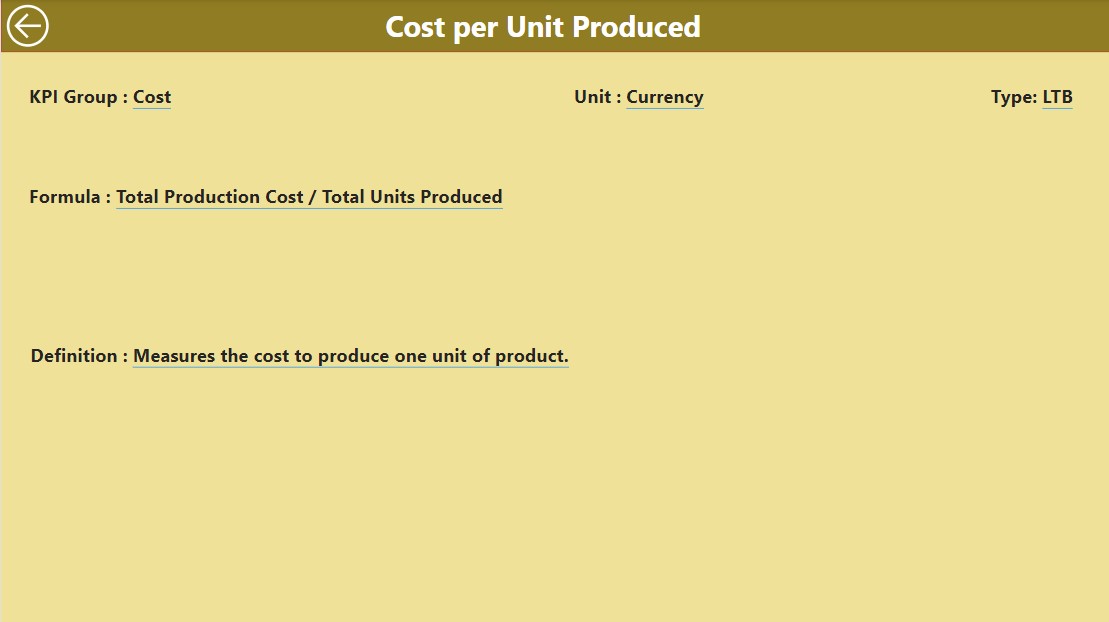
- Drill-Through Capability: Access detailed definitions and formulas of KPIs from the Summary Page, enhancing the understanding and accuracy of KPI measurements.
Excel Data Integration:
Utilizes three key worksheets within an Excel file as the data source:
- Input Actual Sheet: For entering actual KPI data by month.
- Input Target Sheet: For recording target KPI data by month.
- KPI Definition Sheet: To maintain KPI attributes like Number, Group, Name, Unit, Formula, Definition, and Type.