In today’s fast-paced business environment, efficiency and clarity in process management are paramount. The Order Cycle Time KPI Dashboard in Excel is a sophisticated tool designed to enhance your understanding and management of order processing times. This dashboard serves as a comprehensive solution, providing deep insights with just a few clicks. Let’s dive into how this ready-to-use template can revolutionize the way you handle your business metrics.
Click to buy Order Cycle Time KPI Dashboard in Excel
Introduction to Order Cycle Time KPI Dashboard
The Order Cycle Time KPI Dashboard in Excel allows businesses to monitor and analyze the time taken from order placement to delivery completion. It’s crucial for improving and maintaining operational efficiency, ensuring customer satisfaction, and optimizing workflow. This dashboard is equipped with multiple features that make it an indispensable tool for business analysts and operations managers.
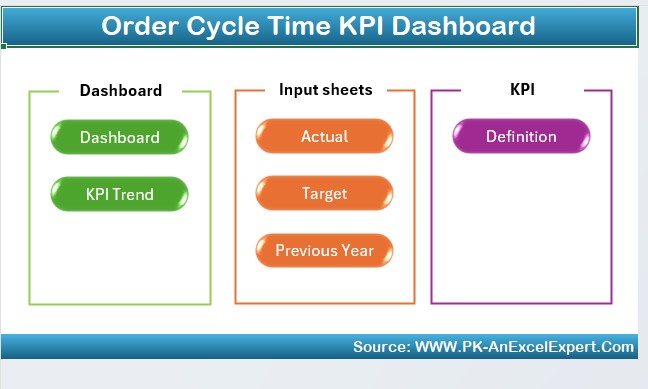
Key Features of the Order Cycle Time KPI Dashboard
Home Sheet: Navigating with Ease
Click to buy Order Cycle Time KPI Dashboard in Excel
The Home sheet acts as the command center of the dashboard. Here, you’ll find six buttons that instantly take you to the respective sheets, making navigation seamless and intuitive.
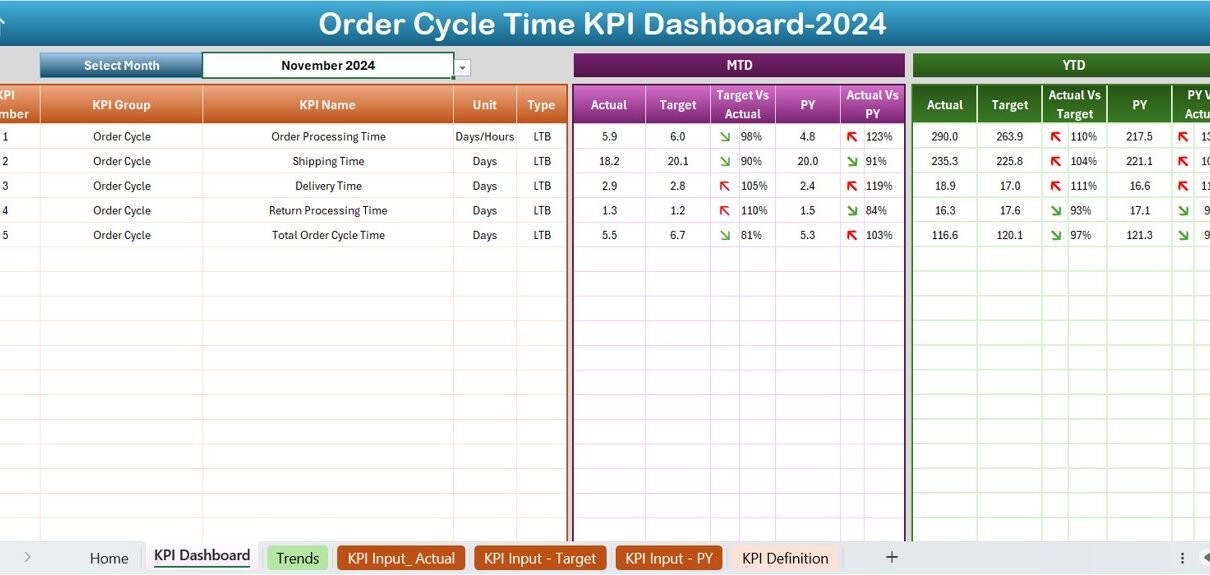
Dashboard Sheet Tab: A Comprehensive Overview
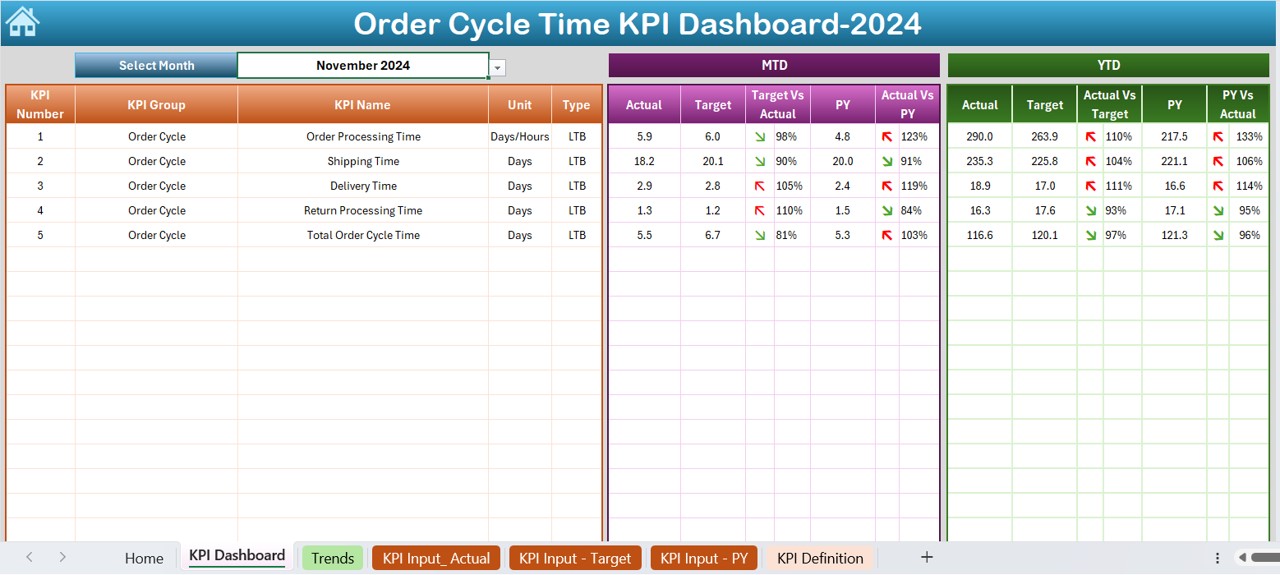
This main tab displays vital KPIs, adjustable by month via a dropdown on range D3. It shows Month-to-Date (MTD) and Year-to-Date (YTD) actuals, targets, and previous year data. The dashboard enhances data interpretation with visual aids like conditional formatting arrows, indicating performance against targets and year-over-year comparisons.
Click to buy Order Cycle Time KPI Dashboard in Excel
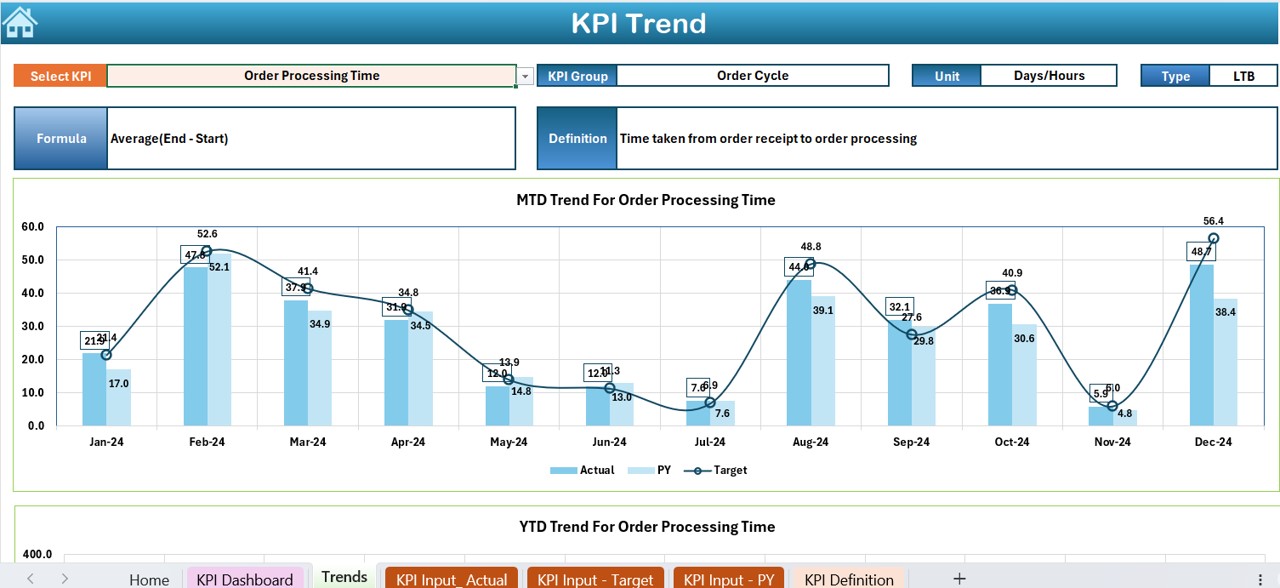
KPI Trend Sheet Tab: Visual Trends and Analytics
Click to buy Order Cycle Time KPI Dashboard in Excel
Select a KPI from the dropdown at C3 to view its group, unit, type (indicative of performance goals), formula, and definition. The tab also includes trend charts for MTD and YTD, providing a graphical representation of actuals, targets, and previous year figures.
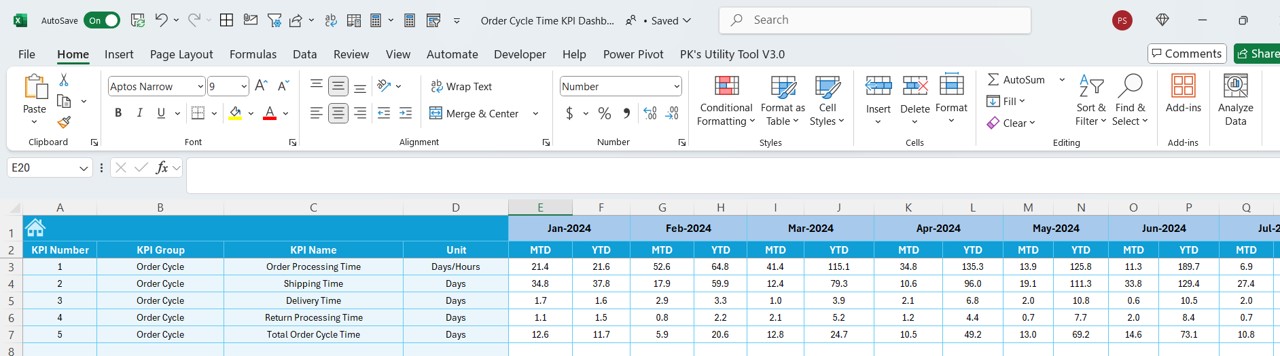
Actual Numbers Input Sheet: Data Entry Made Simple
Click to buy Order Cycle Time KPI Dashboard in Excel
Enter the actual MTD and YTD numbers for each month. The sheet is designed to update automatically when you set the year’s starting month in range E1.
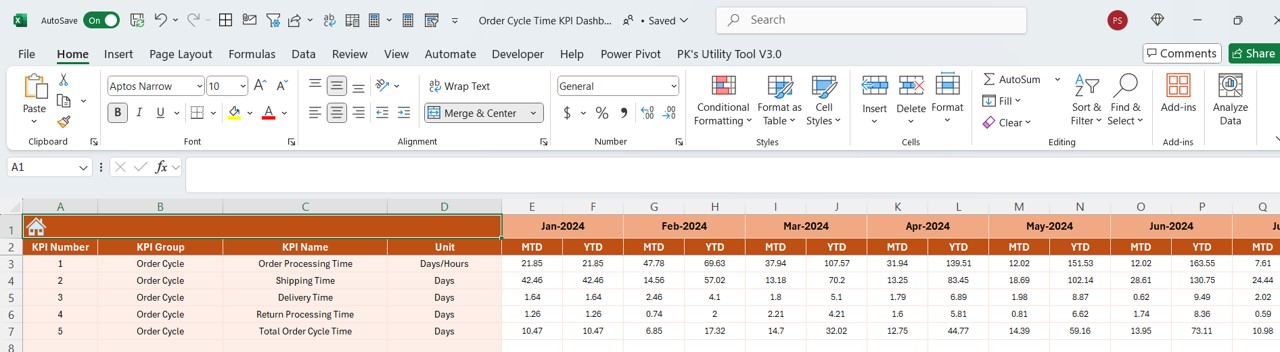
Target Sheet Tab: Setting Performance Goals
Click to buy Order Cycle Time KPI Dashboard in Excel
This sheet is where you input monthly target figures for each KPI, both MTD and YTD, facilitating direct performance comparison.
Previous Year Number Sheet Tab: Historical Data Insights
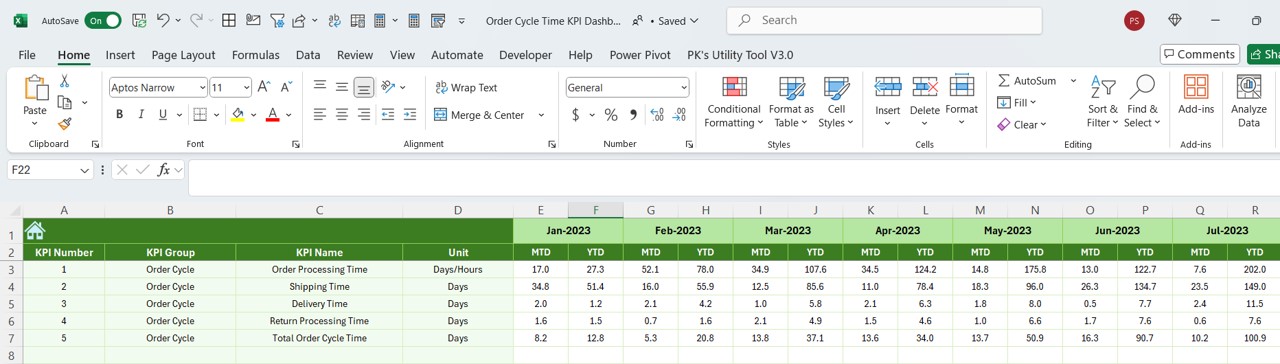
Input last year’s data to compare current performance against past results, crucial for long-term trend analysis and strategic planning.
Click to buy Order Cycle Time KPI Dashboard in Excel
KPI Definition Sheet Tab: Understand Every Metric
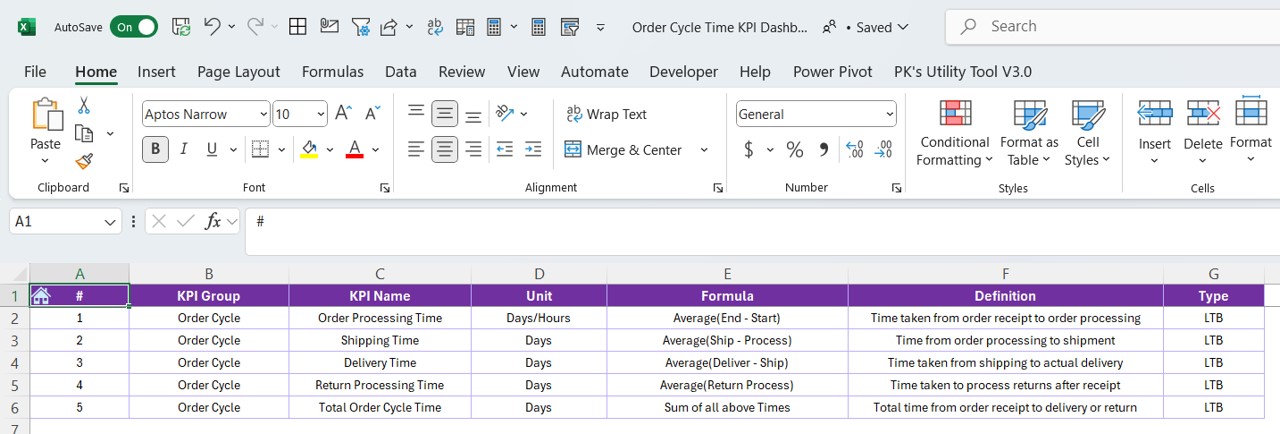
Define each KPI by entering its name, group, unit, formula, and detailed description, ensuring clarity and consistency across the organization.
Advantages of Using the Order Cycle Time KPI Dashboard
- Enhanced Decision-Making: With all critical data points and trends at your fingertips, make informed decisions quickly.
- Time Efficiency: Reduce the time spent on data gathering and analysis through automation and centralized reporting.
- Accuracy and Reliability: Minimize errors with a structured input and reporting format, enhancing data integrity.
- Goal Tracking: Easily track performance against targets, facilitating proactive management and adjustments.
Best Practices for Implementing the Order Cycle Time KPI Dashboard
- Regular Updates: Keep the dashboard updated with real-time data to ensure accuracy in reporting and decision-making.
- Comprehensive Training: Train relevant team members on how to use the dashboard effectively, ensuring they understand all functions and data points.
- Data Validation: Implement checks to validate data input, reducing the risk of errors.
- Feedback Loop: Regularly collect feedback from users to continuously improve the dashboard’s functionality and user experience.
Conclusion
The Order Cycle Time KPI Dashboard in Excel is more than just a reporting tool; it’s a comprehensive solution that provides actionable insights into your business operations. By leveraging this powerful dashboard, businesses can ensure efficient order processing, enhance customer satisfaction, and drive continuous improvement in their operational practices.
Frequently Asked Questions with Answers
Q. How do I customize the dashboard for my specific business needs?
You can customize the dashboard by modifying the KPI definitions, input ranges, and conditional formatting rules to align with your unique business requirements.
Q. Can the dashboard handle large datasets?
Yes, the dashboard is capable of handling large datasets, though performance may vary based on your system’s specifications. Consider optimizing data handling by using Excel’s advanced data model features if necessary.
Q. Is training necessary for all staff?
While the dashboard is user-friendly, training is recommended to ensure all users are capable of utilizing its full range of features effectively.
Click to buy Order Cycle Time KPI Dashboard in Excel
Visit our YouTube channel to learn step-by-step video tutorials
View this post on Instagram
Click to buy Order Cycle Time KPI Dashboard in Excel


