This ready-to-use dashboard enables businesses to track critical AI and ML metrics in real-time, making it easier for decision-makers to analyze performance, identify trends, and take informed actions. In this article, we’ll explore the AI & Machine Learning KPI Dashboard in Power BI, its features, how it tracks AI/ML performance, its advantages, opportunities for improvement, and best practices for using this tool effectively.
Key Features of the AI & Machine Learning KPI Dashboard
The AI & Machine Learning KPI Dashboard is designed with several key features to help track the performance of AI and ML models effectively. Below are the main components of the dashboard, all housed within the Power BI desktop application:
1. Summary Page: The Core of the Dashboard
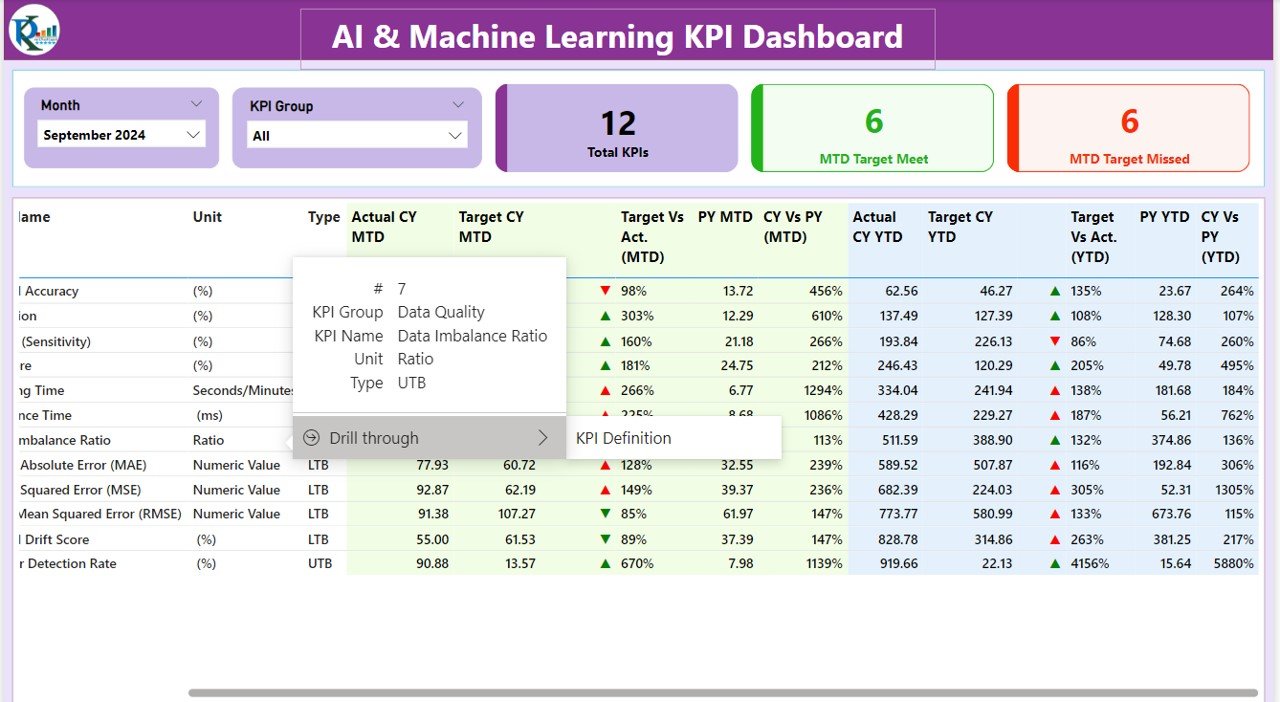
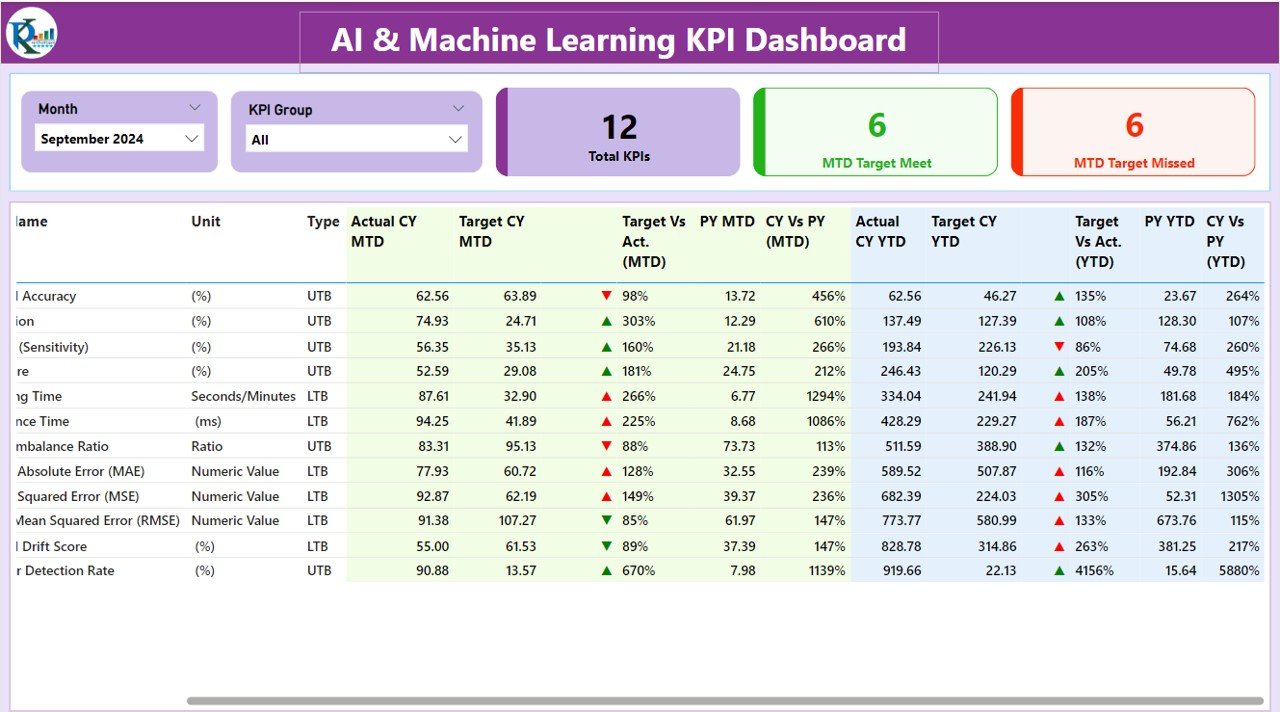
The Summary Page serves as the main page of the dashboard, offering a high-level overview of the key AI/ML performance metrics. It includes the following components:
Slicers: The slicers at the top of the page allow users to filter the data by Month and KPI Group, making it easy to drill down into specific time periods and KPI categories.
KPI Cards: Three prominent cards display the following:
- Total KPIs Count: Shows the total number of KPIs being tracked for AI and ML models.
- MTD Target Met Count: Displays how many KPIs have met their Month-to-Date (MTD) targets.
- MTD Target Missed Count: Shows how many KPIs have missed their MTD targets.
Detailed Table: The table below the cards provides a deep dive into each KPI, including the following columns:
- KPI Number: A unique identifier for each KPI.
- KPI Group: Categorizes the KPI into specific AI or ML performance groups.
- KPI Name: The name of the KPI being tracked (e.g., accuracy, training time, etc.).
- Unit: The unit of measurement for the KPI (e.g., percentage, time, etc.).
- Type: The type of KPI (e.g., Lower the Better – LTB or Upper the Better – UTB).
- Actual CY MTD: The actual value for the current year’s MTD.
- Target CY MTD: The target value for the current year’s MTD.
- MTD Icon: Green and red arrows (▲ and ▼) show whether the KPI is meeting its MTD target.
- Target vs. Actual (MTD): Displays the percentage comparison between the actual and target MTD values.
- PY MTD: MTD values for the same period in the previous year for comparison.
- CY vs PY (MTD): The percentage comparison of the current year’s MTD against the previous year’s MTD.
- Actual CY YTD: The actual value for the current year’s Year-to-Date (YTD).
- Target CY YTD: The target value for the current year’s YTD.
- YTD Icon: Icons that indicate whether the YTD target has been met (green for on target, red for missed).
- Target vs. Actual (YTD): Displays the percentage comparison between the actual and target YTD values.
- PY YTD: YTD values for the previous year.
- CY vs PY (YTD): The percentage comparison between the current year’s YTD and the previous year’s YTD.
2. KPI Trend Page: Visualizing AI & ML Performance Over Time
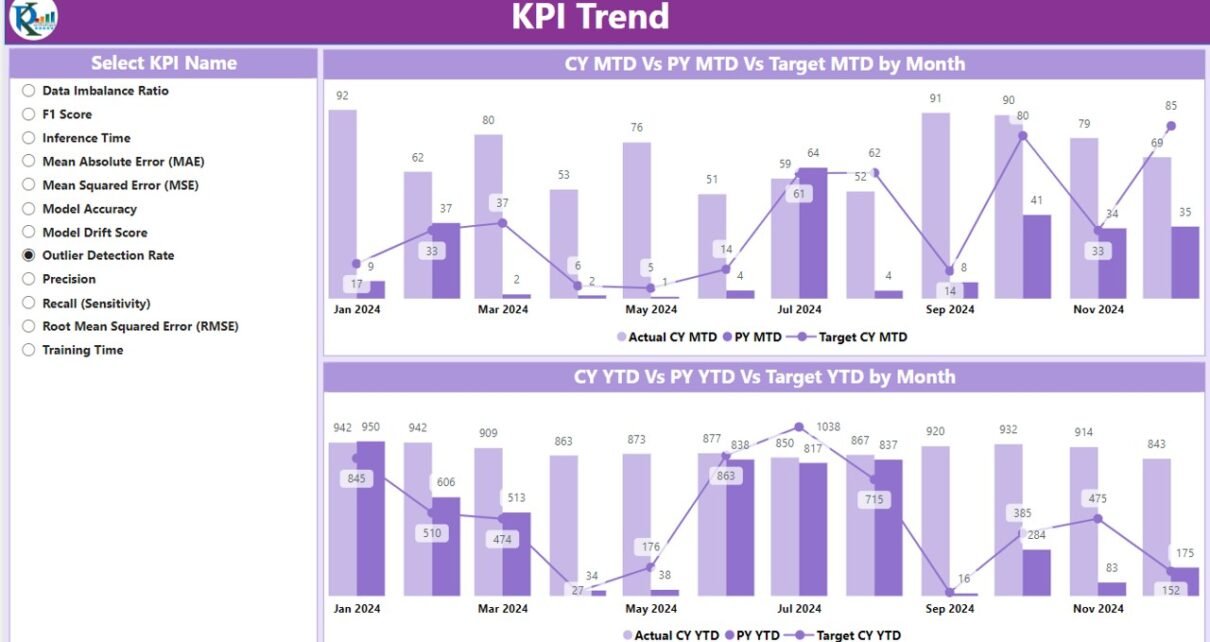
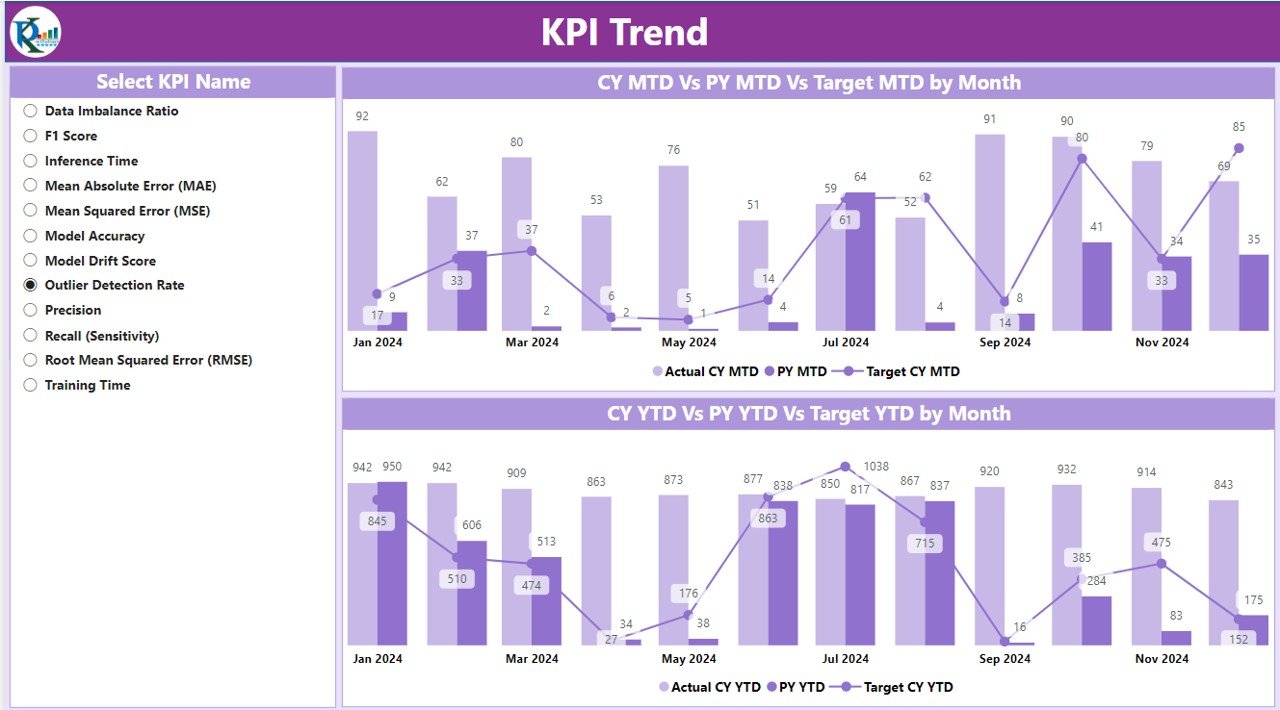
The KPI Trend Page focuses on the historical performance of KPIs. This page displays two combo charts:
- Combo Chart 1: Displays actual numbers for the current year’s MTD and YTD values.
- Combo Chart 2: Displays the previous year’s MTD and YTD values for comparison.
A slicer is available on the left to select a specific KPI, allowing users to focus on the performance of individual AI/ML models over time.
3. KPI Definition Page: Drill Through for Deeper Insights
The KPI Definition Page is a hidden page that users can access through a drill-through action. From the Summary Page, users can click on a specific KPI to view detailed information such as:
- The formula used to calculate the KPI.
- A thorough definition of the KPI.
