In the modern energy landscape, tracking key performance indicators (KPIs) for solar energy systems is critical for optimizing performance, reducing costs, and improving overall efficiency. Our Solar Energy KPI Dashboard in Power BI provides a comprehensive, interactive tool that helps energy analysts, project managers, and executives monitor their solar energy projects effectively. With easy-to-use visuals, real-time insights, and detailed metrics, this dashboard empowers you to make data-driven decisions that positively impact your energy operations.
Key Features of the Solar Energy KPI Dashboard in Power BI:
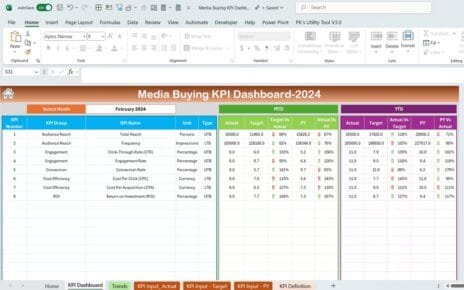
- Summary Page: Provides a high-level overview of key solar energy performance metrics, including total KPIs, targets met, and missed targets for the month.

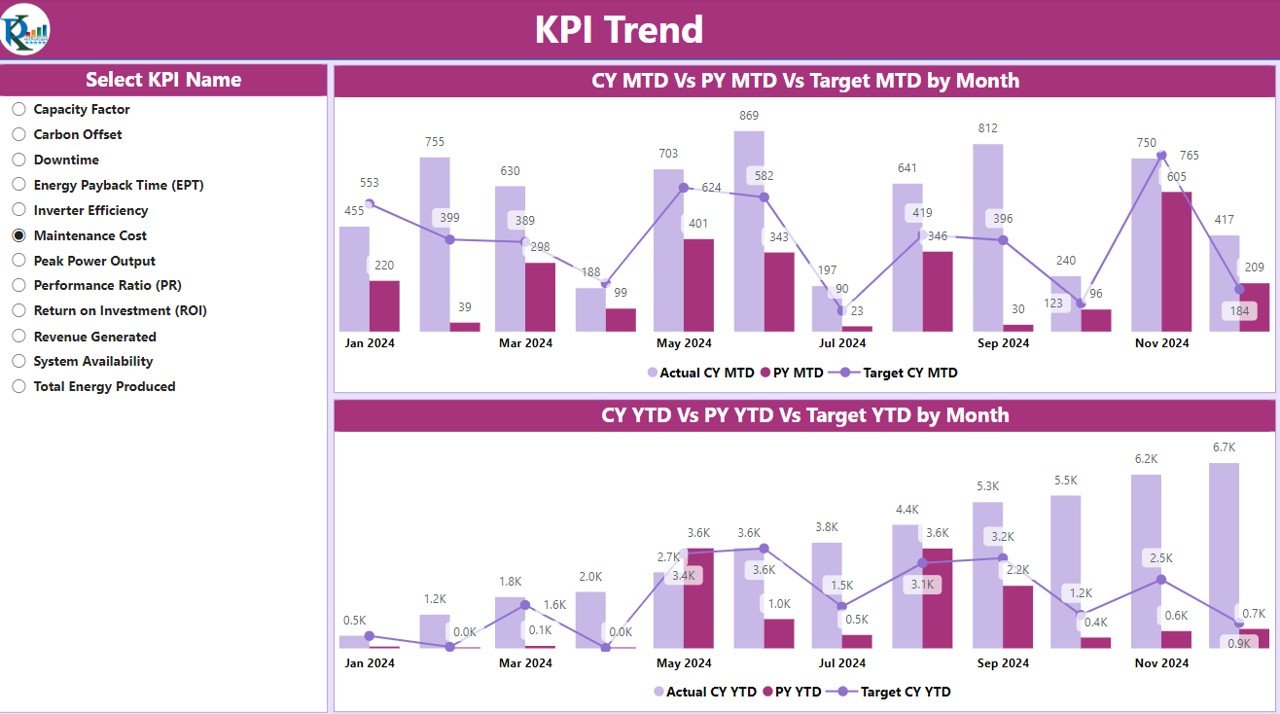
- KPI Trend Page: Visualizes the performance of KPIs over time, allowing for easy comparison of current year and previous year metrics using combo charts.
- KPI Definition Page: A drill-through page that provides detailed definitions, formulas, and the type of each KPI, helping you understand how the performance metrics are calculated.

- Excel Data Integration: Allows seamless integration with Excel for managing real-time data and keeping the dashboard updated.
- Real-Time Insights: Provides immediate feedback on performance, ensuring timely adjustments to optimize energy generation and system efficiency.