In the fast-paced world of event planning and management, understanding the return on investment (ROI) for every event is crucial. Whether you’re organizing a corporate seminar, a product launch, or a large conference, tracking the success of the event can be a challenge without the right tools. That’s where the Event ROI KPI Dashboard in Excel comes in. This ready-to-use template is designed to help event planners and business owners track and evaluate key performance indicators (KPIs) for every event, ensuring that decisions are data-driven and aligned with the event’s objectives.
Key Features of the Event ROI KPI Dashboard in Excel
Our Event ROI KPI Dashboard in Excel offers a range of powerful features that streamline the process of event tracking and reporting:
Home Sheet:
The central hub of the dashboard. This sheet acts as an index, allowing users to easily navigate to other sheets using six buttons for quick access to necessary data and visualizations.
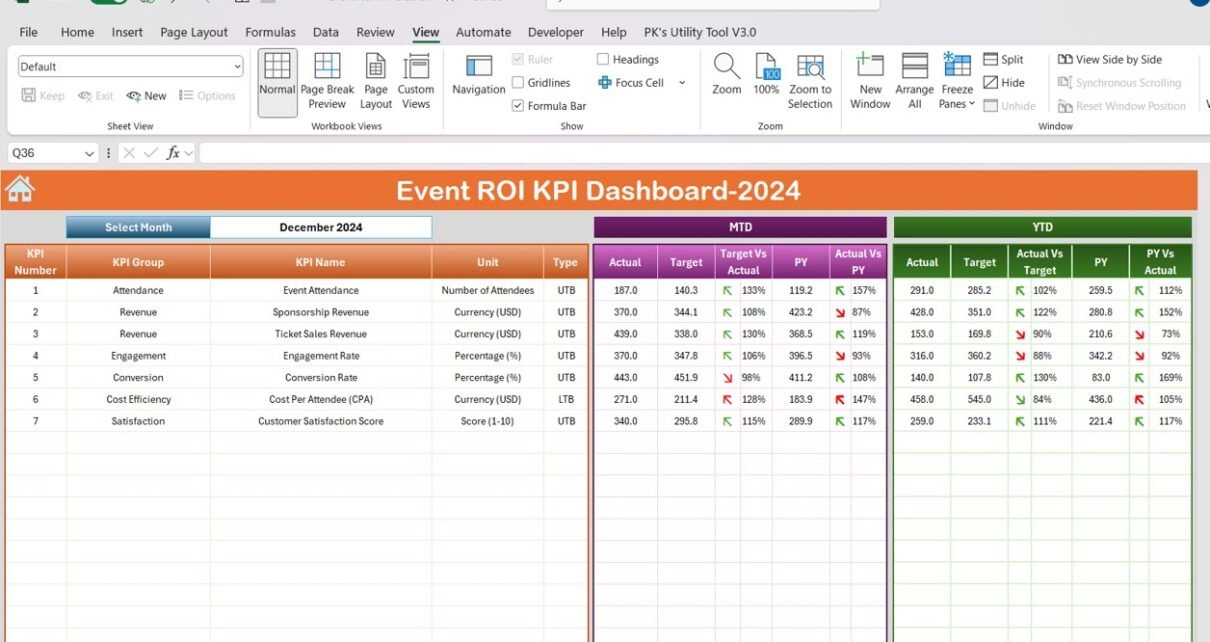
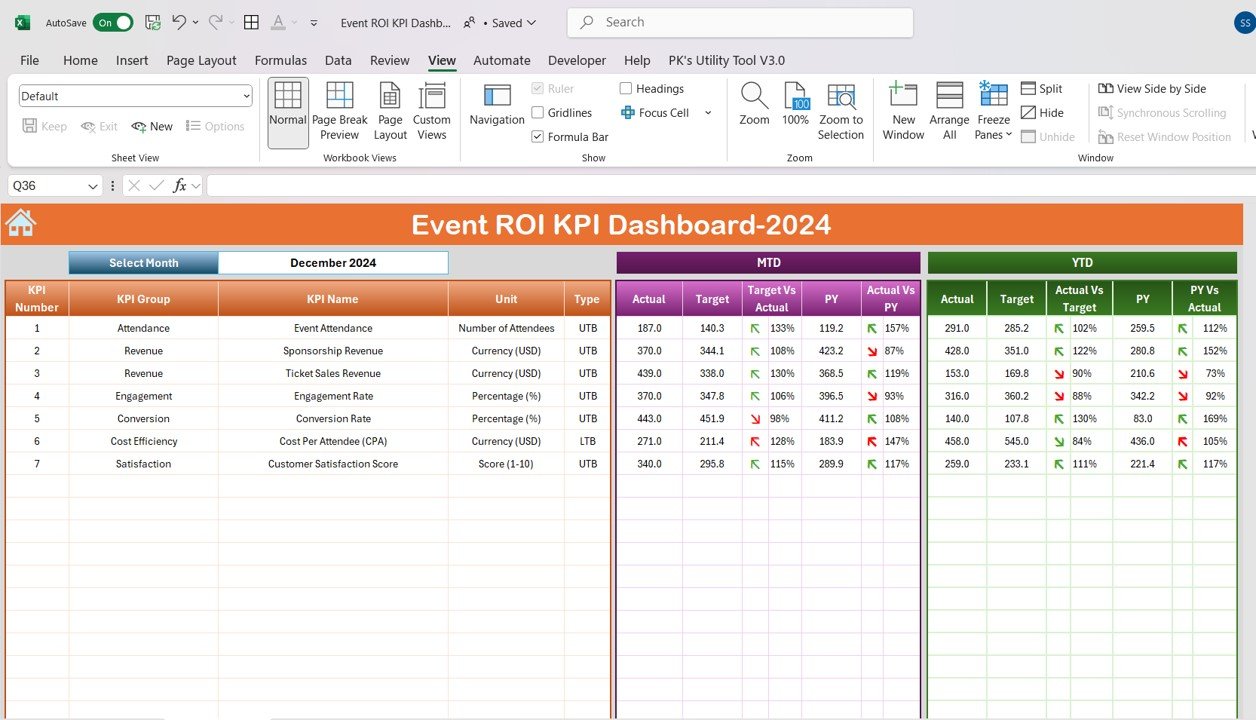
Dashboard Sheet Tab:
The main tab where all the KPIs are displayed. You can select the month using a dropdown in Range D3, and the entire dashboard will update with data for that month. This tab displays MTD (Month-to-Date) and YTD (Year-to-Date) actual data, targets, and comparisons with previous year data. Conditional formatting is used for Target vs. Actual and Previous Year vs. Actual, with up/down arrows for visual indicators.
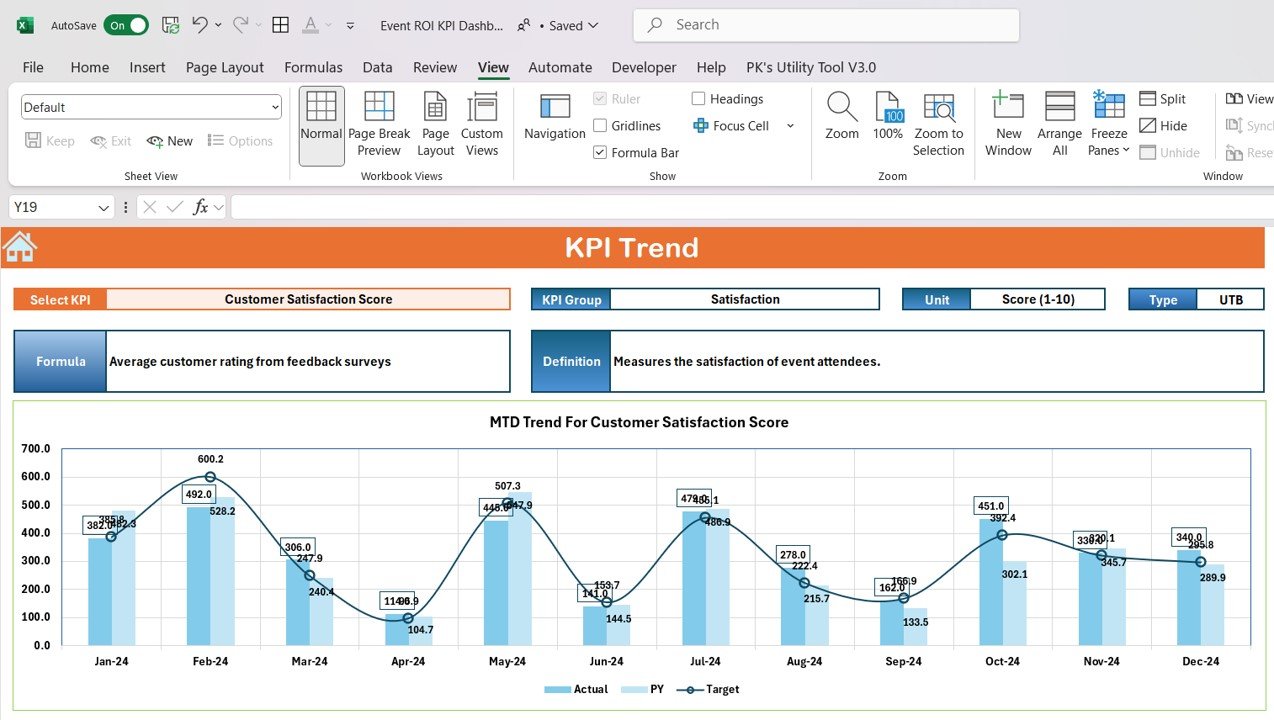
KPI Trend Sheet Tab:
This sheet provides a detailed breakdown of each KPI. You can select a specific KPI from the dropdown in Range C3, and the sheet displays the KPI group, unit of measurement, formula, and whether it’s a “lower the better” or “upper the better” KPI.
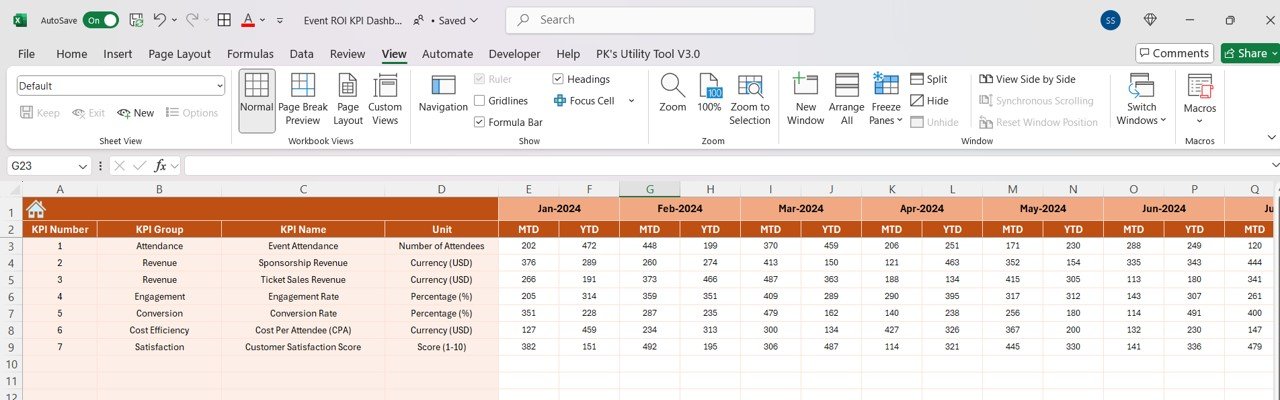
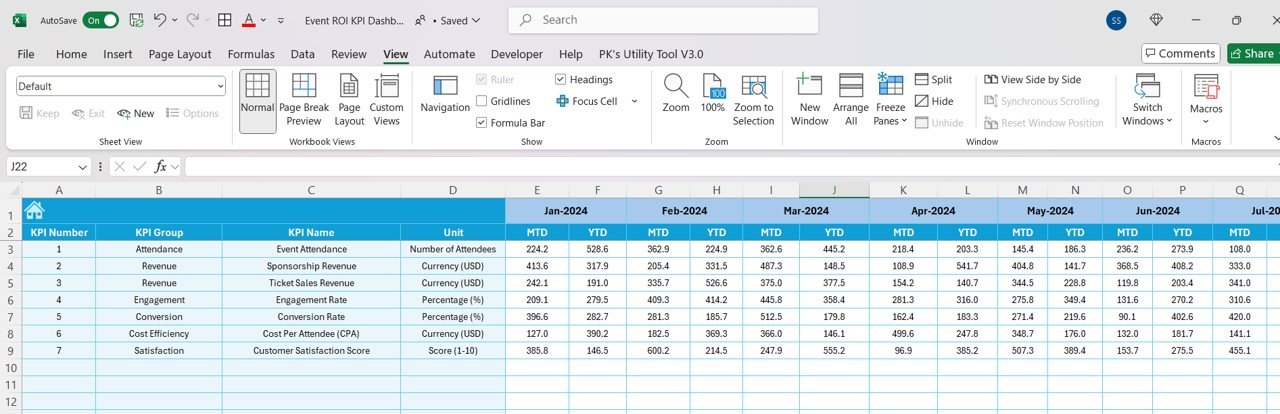
Actual Numbers Sheet Tab:
This tab allows you to enter MTD and YTD actual numbers for each KPI. Data can be updated based on the month selected in Range E1, making it easy to track performance month by month.
Target Sheet Tab:
Input target numbers for each KPI for both MTD and YTD. This allows you to compare actual performance against the set goals for the event.
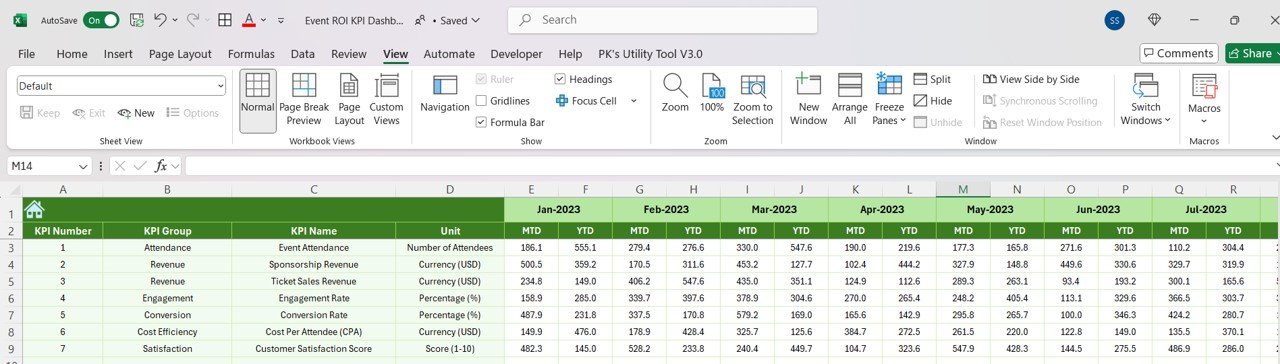
Previous Year Numbers Sheet Tab:
A comparison sheet where you can enter data from the previous year to compare it against the current year’s performance, providing insight into year-over-year trends.
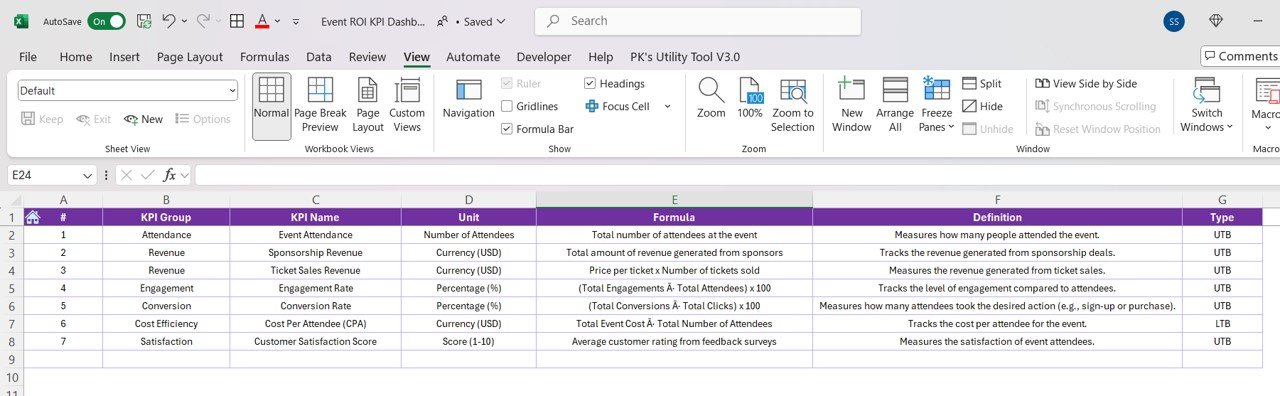
KPI Definition Sheet Tab:
Define each KPI in this sheet, including the KPI name, group, unit of measurement, formula, and detailed description for clarity and ease of use.