The Reseller KPI Dashboard in Excel is a powerful, ready-to-use template designed to simplify the tracking and analysis of reseller performance. This dynamic dashboard provides a comprehensive overview of KPIs, helping you make data-driven decisions with ease.
Key Features of the Reseller KPI Dashboard
Home Sheet
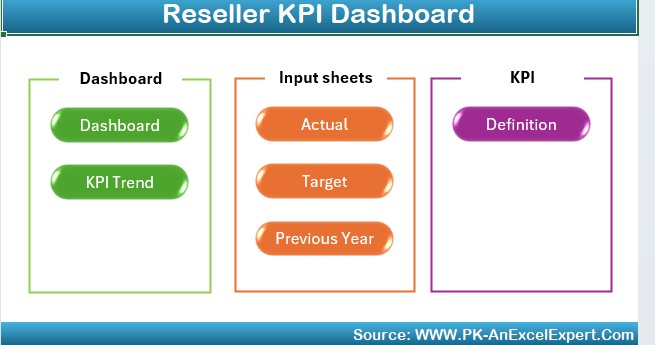
- A central index with six interactive buttons for seamless navigation between sheets.
Dashboard Sheet Tab
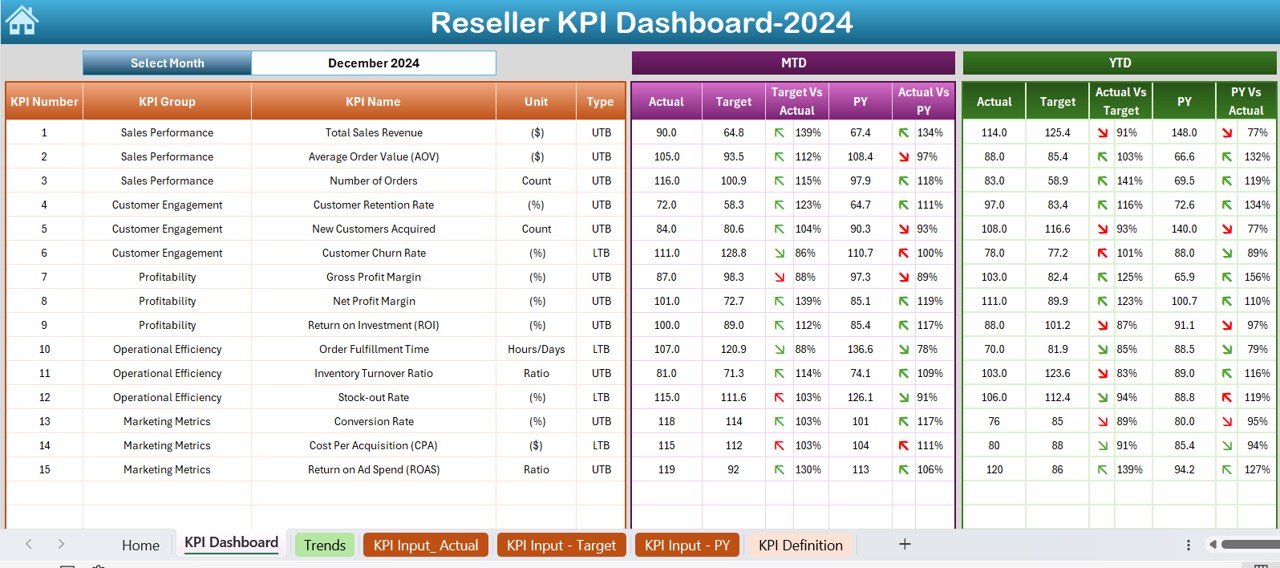
- Dynamic month selection to update all KPI data.
MTD and YTD values for Actual, Target, and Previous Year.
- Visual indicators with conditional formatting for quick insights into performance trends.
KPI Trend Sheet Tab
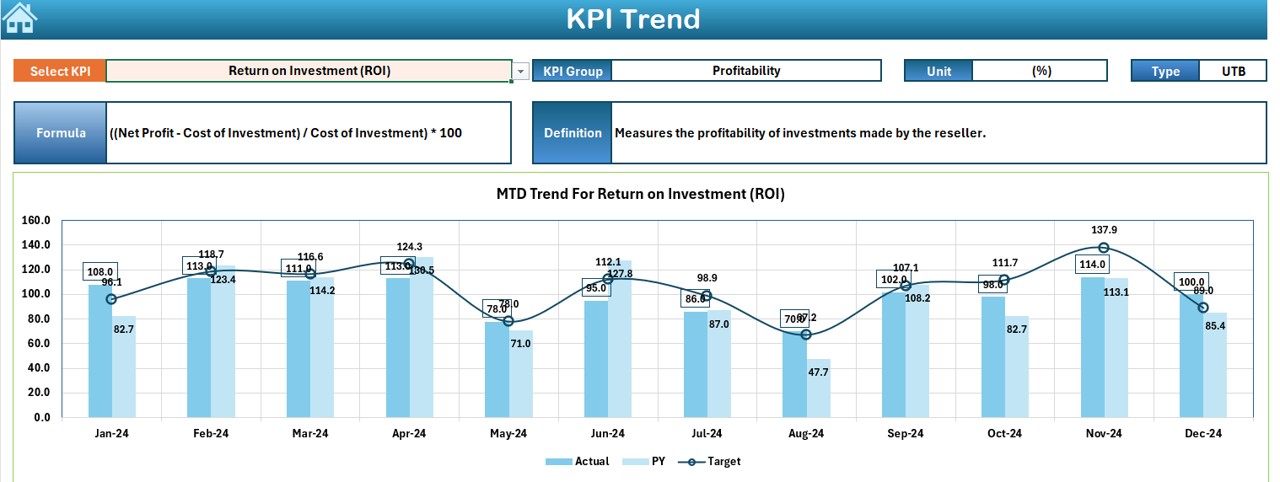
- Select and analyze specific KPIs with detailed group, unit, type, and formula definitions.
- MTD and YTD trend charts for enhanced visualization.
Actual Numbers Input Sheet
- Input YTD and MTD actual performance data effortlessly.
- Adjustable starting month for flexibility.
Target Sheet Tab
- Enter monthly and yearly targets to track progress against goals.
Previous Year Numbers Sheet Tab
- Record previous year\u2019s data for precise comparisons.
KPI Definition Sheet Tab
- Define each KPI with clear details, including name, group, unit, formula, and purpose.