The EdTech KPI Dashboard in Power BI is an essential tool designed for educational institutions and organizations in the EdTech sector to track, analyze, and improve key performance indicators (KPIs). With its ability to manage large sets of data and present them in a visually intuitive manner, this Power BI dashboard provides users with real-time insights into their educational programs’ performance. It allows organizations to make data-driven decisions that can enhance both the effectiveness and impact of their initiatives.
Key Features of the EdTech KPI Dashboard in Power BI
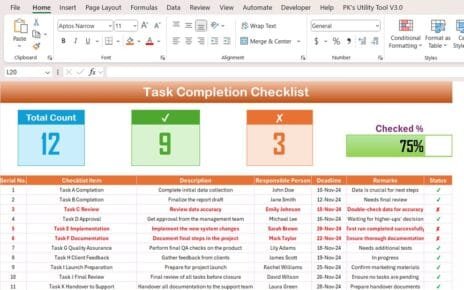
- Comprehensive Data Tracking: The dashboard integrates with Excel data to manage and monitor multiple KPIs across various educational programs. The dashboard’s ability to handle both MTD (Month-to-Date) and YTD (Year-to-Date) values ensures a comprehensive view of progress over time.

- Interactive Summary Page: The main page includes slicers for Month and KPI Group, offering easy customization to view data by specific timeframes and categories. Key information like total KPIs, MTD targets, and status indicators (using red/green icons) are all available for quick analysis.
- Detailed KPI Trend Visualization: With combo charts that compare Actual values of the current year with Previous Year numbers and targets for both MTD and YTD, the KPI Trend page enables the identification of performance trends.

- KPI Definition Access: The hidden drill-through page provides users with access to detailed KPI formulas, definitions, and methodologies, ensuring clarity in performance measurement.