The Podcast Performance KPI Dashboard in Excel is an essential tool for podcasters aiming to track, analyze, and optimize their podcast’s performance. This ready-to-use template helps you monitor key metrics, evaluate listener engagement, and make data-driven decisions to grow your podcast’s reach and success. Whether you’re looking to refine your content, improve engagement, or optimize your marketing efforts, this dashboard provides the insights you need.
Key Features of the Podcast Performance KPI Dashboard
This Podcast Performance KPI Dashboard comes equipped with 7 user-friendly worksheets that simplify tracking and managing key podcast metrics:
Home Sheet:
Central hub for the dashboard, offering quick navigation to the other sheets for easy data management.

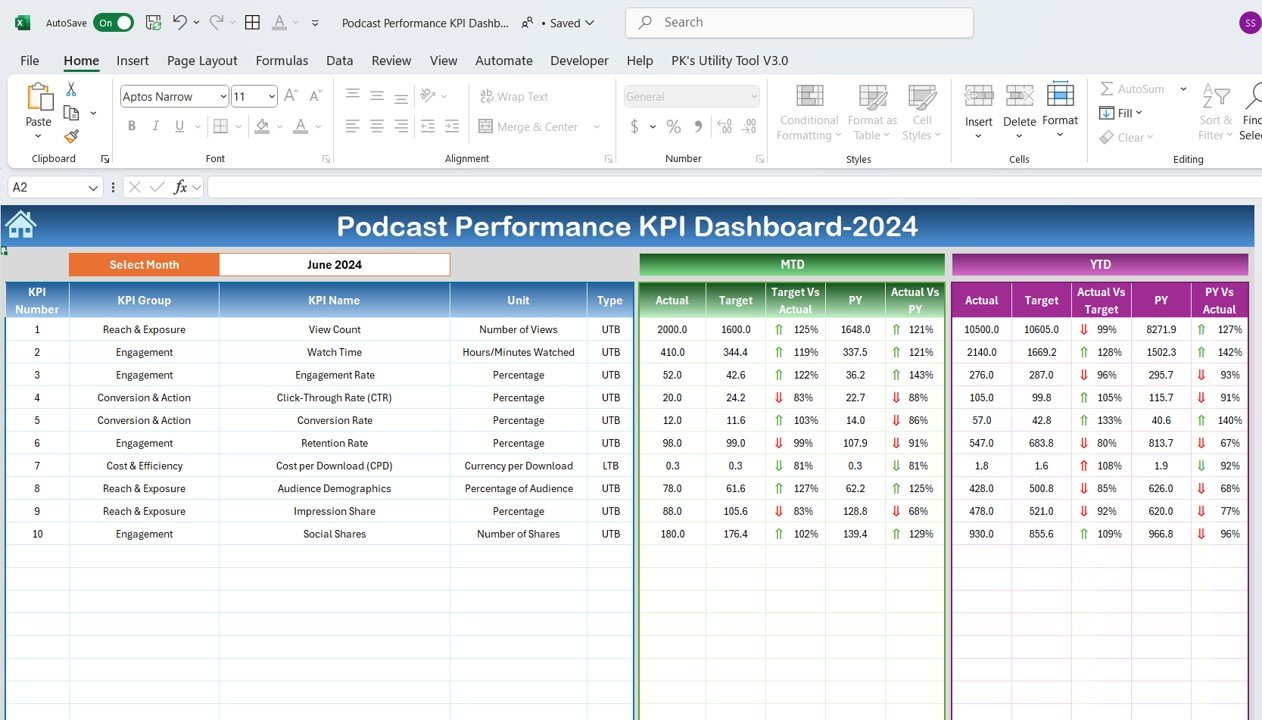
Dashboard Sheet Tab:
View key metrics for each month, including MTD (Month-to-Date) and YTD (Year-to-Date) data, along with comparisons to targets and previous year data.
KPI Trend Sheet Tab:
Track the trends of your KPIs over time, with detailed breakdowns of each metric’s group, unit, formula, and type.

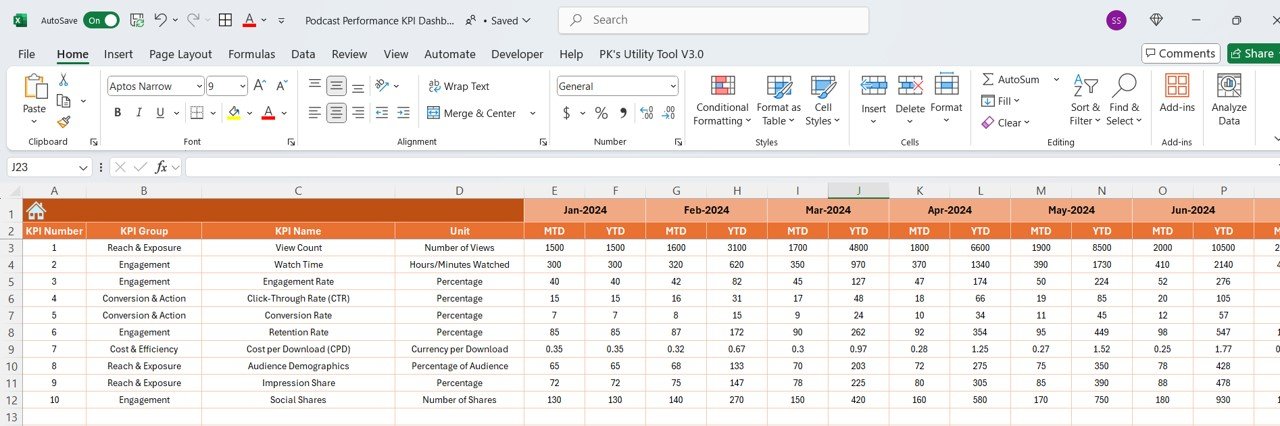
Actual Number Sheet Tab:
Input actual performance numbers for MTD and YTD, with the option to select any month for analysis.
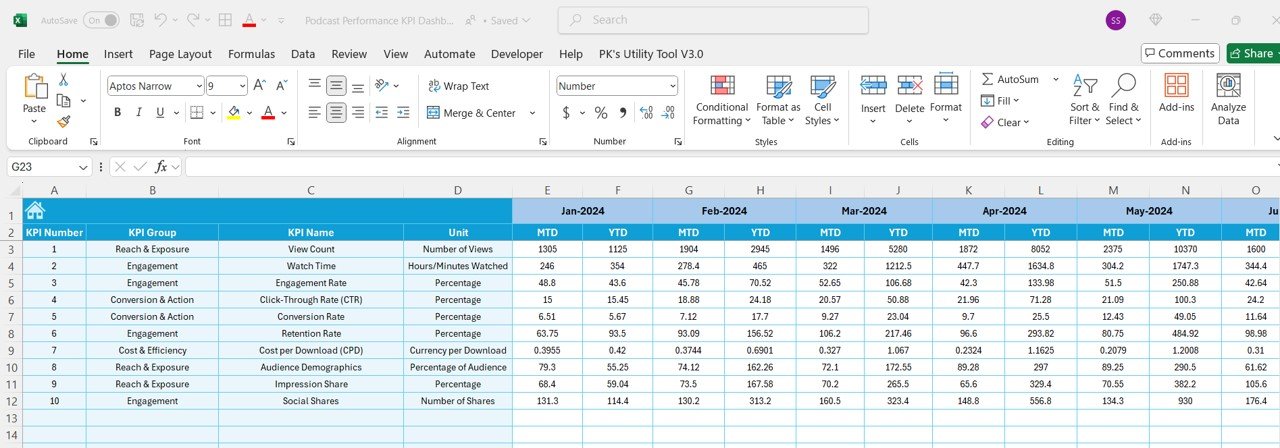
Target Sheet Tab:
Set and manage target numbers for each KPI, both for MTD and YTD, ensuring you track progress against your goals.
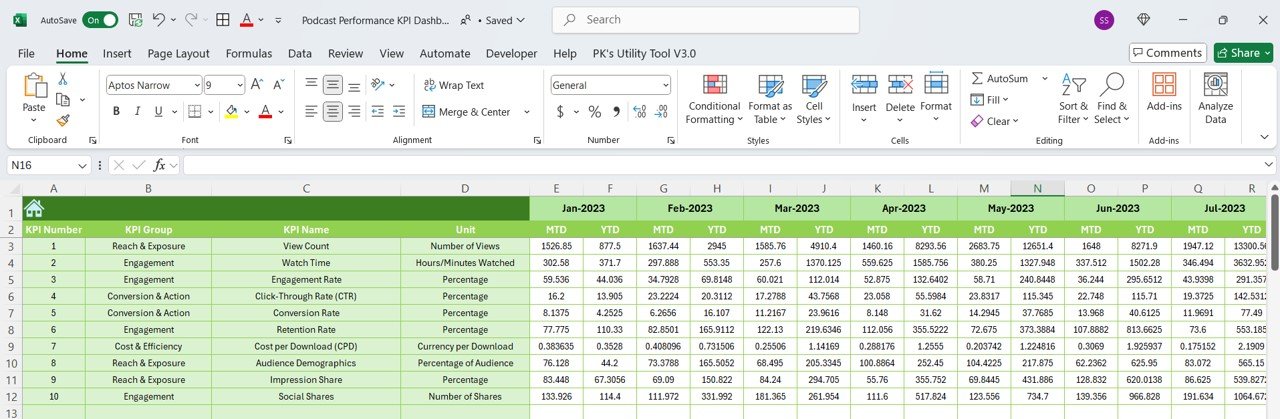
Previous Year Number Sheet Tab:
Enter and compare data from the previous year to analyze performance trends over time.
KPI Definition Sheet Tab:
Provides clear definitions, formulas, and units for each KPI, ensuring accuracy in data entry and a deeper understanding of each metric.